- Bitcoin slips further below the weekend support as sellers’ grip becomes stronger.
- Support is anticipated at $9,200, likely to guide Bitcoin into consolidation as supported by both the RSI and MACD.
The king of cryptocurrencies Bitcoin is not by any chance out of danger yet. Over the weekend, Bitcoin consolidated between $9,300 support and $9,500 resistance. However, the Asian session on Monday has been characterized by increased selling activity.
Bitcoin has broken below the weekend support, currently valued at $9,270. On the downside, an intraday low has been formed at $9,211 (marking the end of the bearish leg). For now, the goal is to overcome the resistance at $9,300 in order to clear the path for gains towards $9,500.
Technically, the largest cryptocurrency is poised to continue with the spiraling towards $9,000. Note that last week, BTC/USD slumped from $10,000 only managing to find support a few inches from $9,000. However, it is also clear that gains towards $10,000 let alone $9,500 will continue to struggle due to low trade volume.
A glance at various applied technical indicators displays a negative picture for BTC/ The RSI is diving into the oversold which shows that bears have the upper hand. The MACD is stuck marginally under the midline. A slightly bearish divergence from the indicator puts emphasis on the increased selling activities.
For now, support above $9,200 would be key to holding Bitcoin in a safe position awaiting a push towards $9,500. On the upside, resistance is anticipated at $9,300, $9,400 and $9,500 in the near term. Besides, the potential for a correction back to $10,000 is still viable. All in all, the prevailing trend at the time of writing is bearish.
BTC/USD 1-hour chart
-637277864216839300.png)
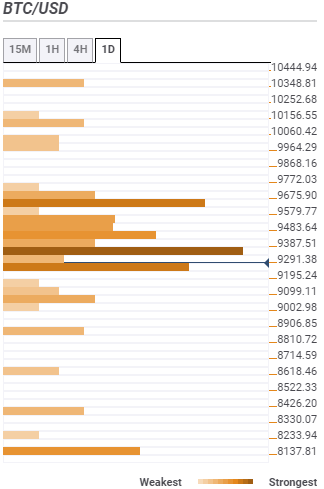
Bitcoin confluence levels
Resistance one: $9,291 – This region is highlighted by the SMA 50 daily, SMA five 15-minutes, the previous high 15-mins, and the Bollinger Band 4-hour lower curve.
Resistance two: $9,387 – This region is home to the Bollinger Band 1-hour middle curve, the Fibonacci 61.8% one-day, and the SMA 50 15-minutes.
Support one: $9,099 – Highlighted by the previous week low, the Bollinger Band daily lower curve, and the pivot point one-week support one.
Support two: $8,906 – Home to the Fibo 61.8% one-month.