- Bitcoin breakout towards $10,000 held back by acute resistance at $9,276.
- A breakout above $9,276 must be followed up by increased trading volume for a rally to -$10,000.
Bitcoin price is still in the red three days in a row. On Tuesday, BTC succumbed to selling pressure, briefly breaking below the support at $9,200. A recovery ensued with Bitcoin spiking towards $9,300, however, an intraday high during the Asian trading session on Wednesday traded at $9,273.10.
In the meantime, Bitcoin has corrected 0.24% under the opening value ($9,255.55). Support at $9,200 is still intact despite the slide on Monday. Although the dominating trend is bullish, low volatility means that no rapid price actions are expected in the near term. For now, bulls will continue to play defense tactics to ensure the price holds above $9,200 in anticipation of a major rally.
Bitcoin confluence levels
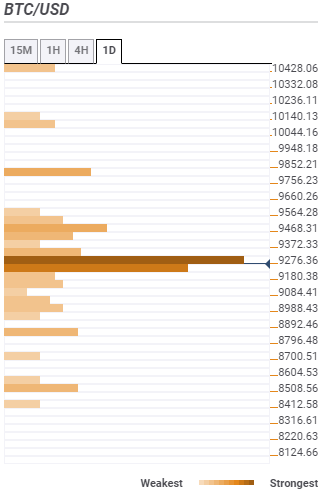
According to the confluence detector tool, Bitcoin bulls have a task to break past the strongest resistance highlighted at $9,276.36. This region houses a cluster of technical indicators from the Bollinger Band 15-minutes lower curve, the previous low 1-hour, previous low 4-hour, SMA ten 4-hour, the Fibonacci 23.6% one-day, the SMA 200 4-hour to the pivot point one-day resistance one among others.
If Bitcoin manages to take down this level, the path to $10,000 would be relatively a smooth one accept for the minor resistance to be anticipated at $9,468 and $9,852. However, buyers must be vigilant enough to follow up on the breakout and ensure Bitcoin is accorded the support and volume for a rally.
On the downside, support is very key to the potential breakout discussed above. Unfortunately, Bitcoin continues to hang in the balance with little support available. Despite that, weak initial support is observed at $9,180. The zone converges several indicators such as the pivot point one-day support one, the Fibonacci 61.8% one-day and the Bollinger Band 1-hour lower curve. Other areas to keep in mind include $9,084, $8,892 and $8,508.