- BTC/USD consolidates in a tight range despite the recovery.
- Bitcoin is vulnerable as long as it stays below $10,000.
Bitcoin (BTС) has been creeping upwards after a short-lived dip to $9,112 low on July 28. The first digital coin touched $9,819 during early Asian hours and retreated towards $9,745 by the time of writing.
Read also: Bitcoin (BTC) price analysis: BTC/USD pushes higher, still below $10,000
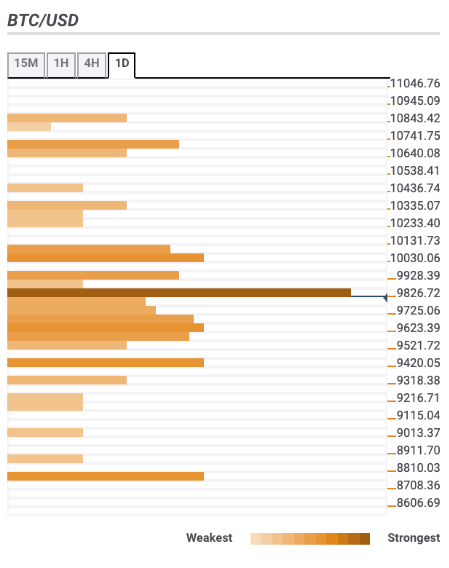
Bitcoin confluence levels
Despite some recovery, Bitcoin and all major altcoins are still moving within tight ranges. Nothing is set for Bitcoin bulls as long as the price stays below critical $10,000. Let’s have a closer look at the barriers that might influence Bitcoin’s movements in the short run.
Resistance levels
$9,900 – 23.6% Fibo retracement weekly, the upper line of 1-hour Bollinger Band, the upper line of 15-min Bollinger Band;
$10,000 – psychological barrier, Pivot Point 1-day Resistance 3, 38.2% Fibo retracement weekly;
$10,350 – 61.8% Fibo retracement weekly.
Support levels
$9,700 – 38.2% Fibo retracement daily, the middle line of 1-hour Bollinger Band, SMA5 (Simple Moving Average) 4-hour;
$9,400 – the lower line of 4-hour Bollinger Band, Pivot Point 1-day Support 1;
$8,750 – Pivot Point 1-week Support 2, SMA100 daily.