- Bitcoin price hangs in the balance with losses likely to hit hard towards $11,500 support.
- Bitcoin’s path of least resistance is downwards based on the negative signals oozing from technical indicators like the MACD.
Bitcoin price is staring into the abyss if the ongoing technical picture remains unchanged. On Monday, FXStreet reported the surge above $12,000 but Bitcoin bulls only managed to trade weekly highs at $12,084. A struggle to contain gains above $12,000 started but eventually, buyers lost the tug of war to the bears.
BTC/USD has continued with the downward action forcing the price below the short term support at $11,800. At the time of writing, Bitcoin has extended the bearish action close to $10,700. It is doddering at $10,745 amid a scuffle to hold above the 50 SMA in the 2-hour range.
Marginally below the 50 SMA is the triangle support. It is essential that Bitcoin holds above this level otherwise a breakdown looms toward the next support target at $11,500. All technical indicators are sending negative signals including the RSI and the MACD. The latter seems to be closing in on the midline and is extending the bearish divergence. Similarly, the RSI could fall under the average anytime and continued action towards 30 would signal more sellers to join the market, thereby pushing the bearish leg farther down.
BTC/USD 2-hour chart
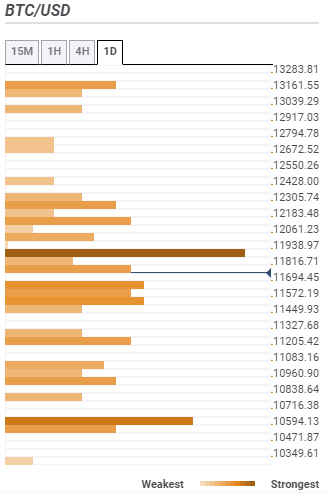
Bitcoin confluence resistance and support areas
Resistance one: $11,816 – Zone highlighted by the Bollinger Band 15-minutes lower curve, Bollinger Band 4-hour middle, the previous high 15-minutes and the SMA 200 15-minutes.
Resistance two: $11,938 – Home to the SMA ten 4-hour, the previous low 4-hour, the SMA 50 15-minutes and the Bollinger Band 15-minutes middle curve among others.
Resistance three: $12,061 – Highlighted by the Bollinger Band 15-minutes upper curve, the previous high 4-hour, the Fibo 23.6% one-day and the Bollinger band 1-hour upper curve.
Support one: $11,694 – Home to the SMA ten one-day, the pivot point one-day support one, the SMA 50 4-hour and SMA 200 1-hour.
Support two: $11,449 – Highlighted by the previous month high and the Bollinger Band 4-hour lower curve.
Support three: $11,205 – Hosts the Fibo 161.8% one-day and the Fibo 38.2% one-week.
%20(19)-637327296535732779.png)

