- BTC/USD has recovered from the intraday low, still under pressure.
- Bears may have an upper hand in the short-run.
BTC/USD is moving within a tight intraday range limited bu $8,500 on the upside and $8,427 on the downside. At the time of writing, the first digital coin is changing hands at $8,465. Bitcoin recovered from Friday’s low of $8,369; however, thee upside momentum failed to gain traction.
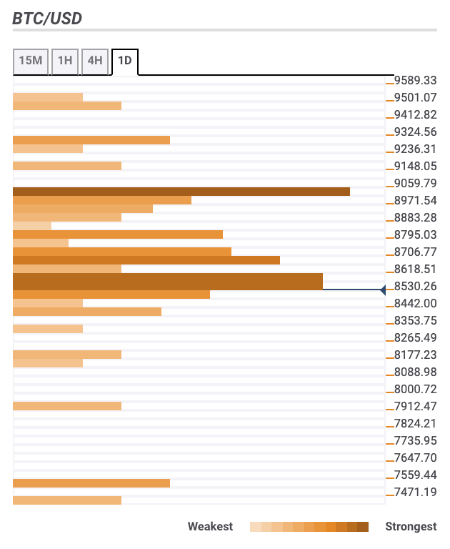
Bitcoin confluence levels
Looking technically, BTC/USD is vulnerable to further losses as the way to the North is packed with strong technical levels. Let’s have a closer look at the technical levels that may serve as resistance and support areas for the coin.
Resistance levels
$8,560-$8,600 – SMA50 (Simple Moving Average) daily and hourly, 61.8% Fibo retracement monthly, the upper line of 1-hour Bollinger Band, 23.6% Fibo retracement weekly
$8,700 – the middle line of 4-hour Bollinger Band, 23.6% Fibo retracement daily
$9,000 – psychological level, SMA100 daily, the middle of the daily Bollinger Band
Support levels
$8,370 – the lowest level of the previous day, the lower line of 4-hour Bollinger Band
$8,150 – Pivot Point 1-week Support 1
$7,900 – Pivot Point 1-week Support 2.