- BTC/USD went up from $8,720.50 to $8,811.45 this Tuesday.
- There are three very healthy support levels on the downside.
BTC/USD has had a bearish start to the day following a bullish Tuesday. So far this Wednesday, the price of the asset went down from $8,811.45 to $8,773. This followed a pretty bullish Tuesday, wherein BTC/USD went up from $8,720.50 to $8,811.45. The hourly chart for Tuesday shows us that BTC/USD was trending horizontally for a bit before it dipped from $8,752.15 to $8,642.85 within four hours. After finding intraday support at the $8,642.85 level, the buyers re-entered the space and took the price up to $8,811.45 to end the day.
BTC/USD daily confluence detector
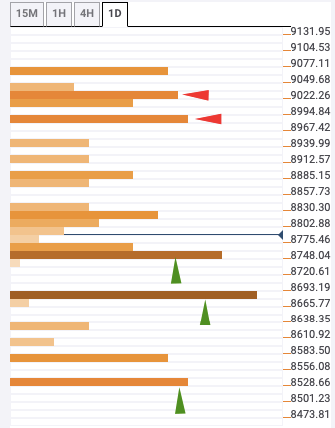
On the upside, there are two resistance levels at $8,985 and $9,030. $8,985 has no confluences detected, while $9,030 has the four-hour Bollinger band upper curve and one-week Fibonacci 38.2% retracement level.
On the downside, there are three support levels at $8,760, $8,675 and $8,540. $8,760 has the one-hour Bollinger band middle curve, 10-day Simple Moving Average (SMA 10), 15-min Bollinger band lower curve and 4-hour previous low. $8,675 has the SMA 200, one-day Fibonacci 61.8% retracement level and previous week low, while the $8,540-level has the one-month Fibonacci 61.8% retracement level.
