- Bitcoin price loses traction after hitting a snag at $9,000; losses likely to continue in the near term.
- On the upside, the two main resistances lie at $8,877 and $9,519 while the first support holds the ground at $8,417.
Bitcoin price failed to make a comeback into the $9,000’s range over the weekend. The stability followed an incredible bullish action on Thursday last week that saw the price high new April highs at $9,466. The bullish action was, however, met by increased selling activity and coupled with the high volatility in the market, pulled Bitcoin into a reversal action, the extent of testing new support at $8,400. A minor recovery ensued but Bitcoin stalled under $9,000.
At the time of writing, BTC/USD is trading 3.97% lower on the day. The price is doddering at $8,566 amid increasing selling activity and high volatility. The RSI is sharply falling from the overbought as a sign of a stronger bearish influence. The MACD bullish divergence is also narrowing to emphasize the influence the sellers are having on the price. It is likely that $8,400 support will be tested in the near term.
BTC/USD daily chart
%20(14)-637241688978838726.png)
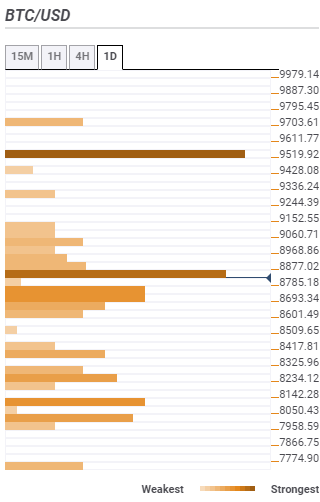
Bitcoin confluence support and resistance levels
The confluence tool shows that Bitcoin is facing two key resistances at $8,877 and $9,519. The indicators highlighted the resistance at $8,877 include the Bollinger Band 15-minutes upper curve, the previous high 4-hour, and the SMA 1-hour. If the price clear this zone, the rise above $9,000 would be relatively smooth.
However, buyers have to anticipate the strong hurdle at $9,519 as highlighted by the previous month high, the previous week high and the pivot point one-day resistance three. On the downside, the first support lies at $8,417 as shown by the pivot point one-day support two and the SMA five one-day. Other subtle support areas include $8,234 and $8,142.