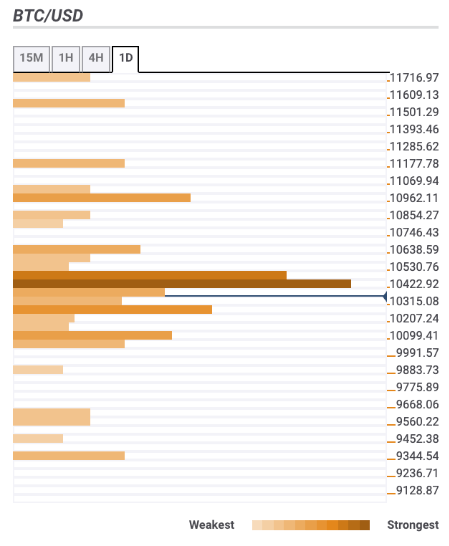
BTC/USD has been volatile during the day.
The critical resistance is seen on approach to $11,000
Bitcoin (BTC) has been rather volatile on Monday. The first digital asset dropped to $10,060 during early Asian hours only to recover above $10,500 ahead of European opening. At the time of writing BTC/USD is changing hands at $10,353, trading with short-term bearish bias within the recent wide range. Notably, the coin has stayed mostly unchanged both on a day-on-day basis and since the beginning of Monday.
Read also: Blockchain technology to have standards by 2021 – Moody’s
Bitcoin confluence levels
There are several strong technical levels above the current price, which means that Bitcoin bulls might have a hard time pushing the price higher. However, a neutral position of the Relative Strength Index (RSI) on the intraday implies that the coin might enter a range-bound phase.
Let’s have a closer look at the barriers that might influence Bitcoin’s movements in the short run.
Resistance levels
$10,500 – SMA50 (Simple Moving Average) 1-hour, SMA10 4-hour, SMA200 15-min, 38.2% Fibo retracement daily and weekly.
$10,600 – the highest level of the previous day, 23.6% Fibo retracement weekly;
$11,000 – the upper line of 1-day Bollinger Band Pivot Point 1-week Resistance 1.
Support levels
$10,300 – SMA100 daily, SMA10 daily, Pivot Point 1-day Support 1;
$10,000 – 61.8% Fibo retracement weekly, the lower line of 15-min Bollinger Band, Pivot Point 1-day Support 1;
$9,850 – Pivot Point 1-day Support 3.

