- BTC/USD went up from $12,580 to $12,915 in the early hours of Wednesday.
- BTC/USD has only one prominent resistance level at $13,225 till $13,500.
BTC/USD has gone up from $12,580 to $12,915 in the early hours of Wednesday, as it strings together five bullish days in a row. The bulls managed to recover the price really well, despite facing a flash crash of $550 in 15 mins this Tuesday. During the crash, the price fell from $12,688 to $12,138. The daily confluence detector shows that there is a moderate resistance level at $13,225 on its path to $13,500.
BTC/USD daily confluence detector
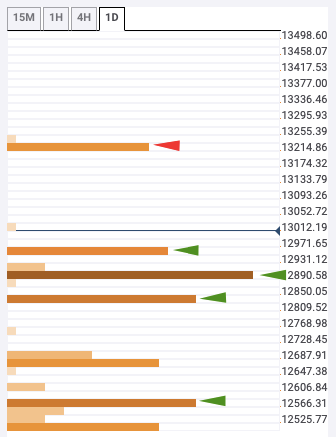
The moderate $13,225 resistance level has the 1-day pivot point resistance 2.
The support levels are at $12,575, $12,825, $12,890 and $12,970. The $12,575 level sees a confluence of daily 38.2% Fibonacci retracement level and 10-day simple moving average (SMA 10) curve. The $12,825 price level has hourly Bollinger band upper curve and 1-day previous high. The strongest support level is at $12,890 which has the SMA 5, 4-hour Bollinger band upper curve and 1-day pivot point resistance 1. Finally, the $12,970 level has the daily Bollinger band upper curve and 15-min Bollinger band upper curve.
