- Bitcoin price recovery cut short marginally above $9,300 ahead of BTC futures contracts expiry.
- Volatility is expected to increase in the course of Friday’s trading sessions.
Bitcoin price recovery hit pause slightly above $9,300 after an impressive bounce from the levels marginally under $9,000. The largest cryptocurrency has been ranging between $9,000 and $10,000 since the beginning of June. The recent surge did not make it past $9,800 despite overcoming last week’s hurdle at $9,600.
After cutting short the recovery, BTC/USD is trading at $9,223 while seeking support above $9,200. Consolidation is expected to take over from now henceforth. However, due to Bitcoin options expiring on major exchanges such as CME, Deribit and BitMEX, volatility is expected to increase massively as we usher in the weekend session.
Supporting sideways action is the sidelong RSI and MACD indicators. The latter is holding tight onto the mean line (0.00). Watching this indicator would help the traders tell the direction Bitcoin price takes, especially with the looming volatility. The RSI is also moving horizontally at the average (50) adding weight to the possibility of consolidation taking over.
As for the bulls, consolidation seems like the best bet to get out of the bearish trap as it will allow them to create fresh demand. It is also apparent that as long as Bitcoin stays under $10,000 bears will continue to have the upper hand. For now, keeping the price above $9,200 is good enough but first, let’s look at the confluence tool for some viable support and resistance areas.
BTC/USD daily chart
-637287437959526447.png)
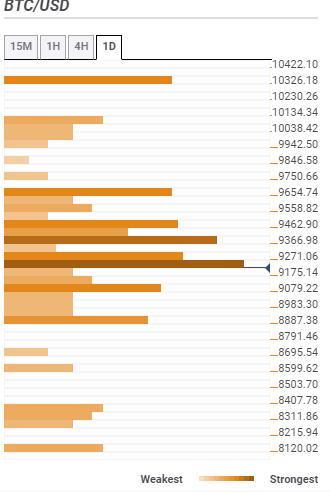
Bitcoin confluence resistance and support levels
Resistance one: $9,271 – A seller congestion zone highlighted by the SMA ten 4-hour, SMA 100 15-minutes, the previous high 15-minutes and the Bollinger Band 15-minutes middle curve.
Resistance two: $9,366 – Highlights by the Fibo 61.8% one-week, the previous high one-day, the SMA 50 4-hour, SMA 200 1-hour and the pivot point one-day resistance one.
Resistance three: $9,462 – The confluence is formed by the Bollinger Band 4-hour middle, the SMA 100 1-hour, SMA 200 4-hour and SMA five one-day.
Support one: $9,175 – This is the initial support according to the confluence tool and is home to the Fibo 38.2% one-week.
Support two: $9,079 – Is the second resistance highlighted by the pivot point one-day support one, Fibo 23.6% one-week and Fibo 23.6 one-day.
Support three: $8,887 – This confluence is home to the previous week’s low and pivot point one-day support two.
More Bitcoin levels
