- BTC/USD has resumed the upside movement after a consolidation period;
- A sustainable move above $9,650 will take the price to $10,000.
Bitcoin (BTC) has resumed the growth after a period of range-bound trading. At the time of writing, BTC/USD is changing hands at $9,500, having gained nearly 2.5% since the beginning of the day and 3% on a day-to-day basis. The upside momentum is gaining traction, however, the further recovery may be limited by a strong resistance created by SMA100 (Simple Moving Average) on a daily chart. The coin has been trading below this indicator since the beginning of September.
Read also: Bitcoin (BTC) jumps above $10,000, what’s going on?
Bitcoin confluence levels
BTC/USD bulls resumed their attempts to take the coin to new highs. After a short period of consolidation, Bitcoin is growing again with the Relative Strength Index (RSI) pointing upwards on all intraday timeframes.
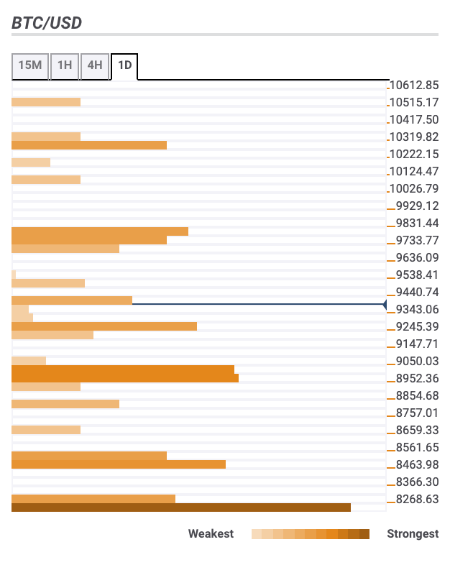
Let’s have a closer look at the technical levels that may serve as resistance and support areas for the coin.
Resistance levels
$9,650 – SMA100 (Simple Moving Average) daily, the highest level of the previous four-hour timeframe;
$9,800 – 38.2% Fibo retracement daily, Pivot Point one-week Resistance 2;
$10,000 – psychological level, 23.6$ Fibo retracement daily;
$10,300 – Point one-month Resistance 1;
Support levels
$9,000 – the upper line of the Bollinger Band on a daily chart, SMA200 on a daily chart, 38.2% Fibo retracement monthly;
Ë$8,500 – 23.6$ Fibo retracement monthly and weekly, the middle line of four-hour Bollinger Band;
$8,200 – SMA50 and SMA100 on a four-hour chart, SMA200 on a one-hour chart, 38.2 Fibo retracement weekly;