- BTC/USD has made another failed recovery attempt.
- $8,100-$8,200 area creates critical resistance for BTC in the short run.
Bitcoin (BTC) attempted to break above $8,000 in five days out of six. However, all the attempts have failed to create a robust bullish momentum needed to take the coin out of this deadlock. At the time of writing, BTC/USD is changing hands at $7,959, unchanged both on a daily basis and since the start of Wednesday trading.
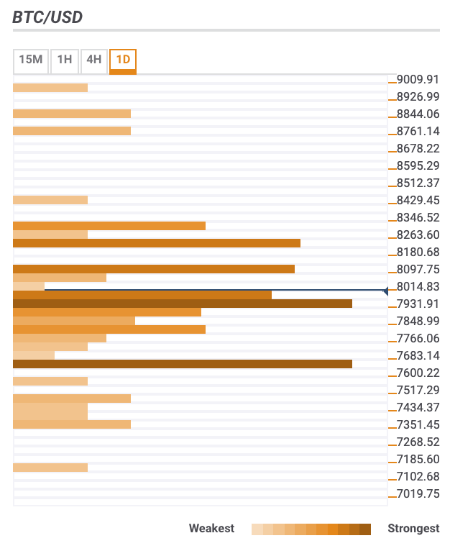
Bitcoin confluence levels
The longer the coin sits in the range, the thicker the support and resistance levels clustered around the current price. On the one hand, it means that we will need a strong trigger to escape the range in either direction. ON the other hand, an eventual breakthrough will result in a violent move.
Resistance levels
$8,100 – the upper line edge of 1-hour Bollinger Band, Pivot Point 1-day Resistance 1, the top edge of 15-min Bollinger Band,
$8,200 – 23.6% Fibo retracement monthly, the middle line of 1-day Bollinger Band, SMA100 (Simple Moving Average) 4-hour.
$8,300161.8% Fibo projections daily, 61.8% Fibo retracement weekly.
Support levels
$7,930 – SMA50 1-hour. SMA200 4-hour, 61.8% Fibo retracement daily.
$7,650 – 38.2% Fibo retracement monthly.
$7,300 – Pivot Point 1-week Support 1.