- BTC/USD are not ready to act.
- A move back below $3,900 might trigger more selling pressure.
BTC/USD dropped like a stone, unable to settle above a critical $3,900 area. The price went as high as $3,947 on Sunday, but it seems that Bitcoin bulls are not ready yet for a decisive breakthrough. BTC/USD moved below SMA50 and SMA100 (1-hour) to trade at $3,877 at the time of writing, off the Asian low touched at $3,847.
BTC/USD the daily confluence detector
We have a bunch of strong technical levels right above the current price and up until $3,950 handle. The resistance zone is going to be a hard nut to crack for Bitcoin bulls. The confluence of technical indicators include:
- Lower boundaries of Bollinger Band on 1-hour and 15-min charts
- A host of significant SMA levels like SMA100 and SMA50 (1-hour), SMA10 (4-hour)
- Fibo retracement levels (38.2% monthly and daily, 23.6% daily, 61.8% daily)
A sustainable move above this area will clear up the way towards the next resistance zone $4,000 (Fibo 23.6% monthly and 61.8% Fibo retracement weekly) and $4,200 strengthened by the previous month high.
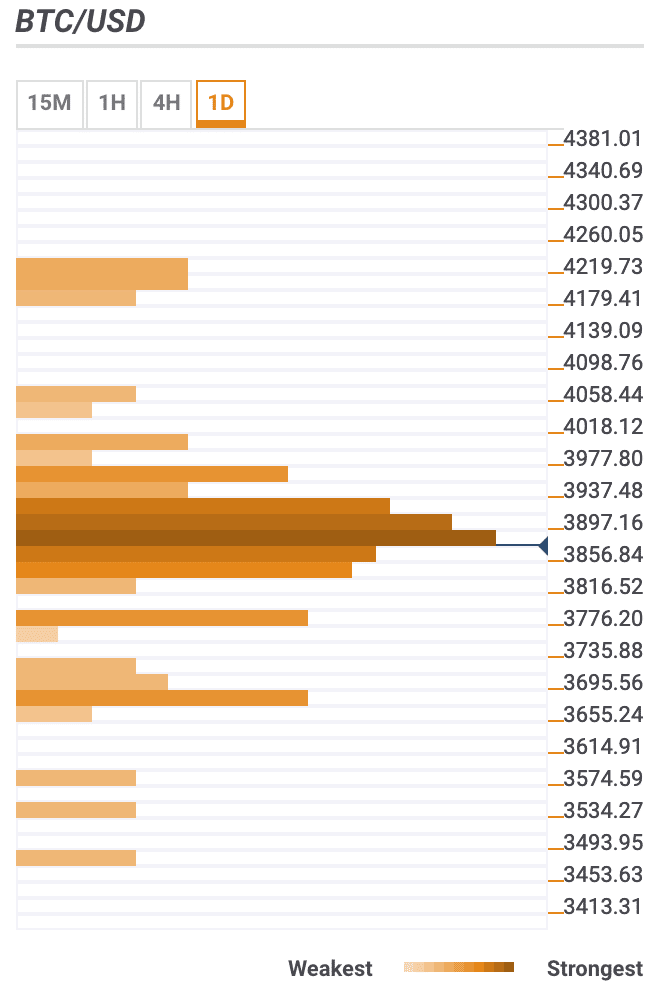
Below the current price, we can see a confluence of technical indicators, including SMA100 (4-hour), midline line of daily Bollinger Bands, a lower boundary of 4-hour Bollinger Band, 23.6% and 38.1% Fibo retracement weekly, SMA50 4-hour, SMA200 1-hour.
The next barrier is seen below $3,800 (Fibo retracement 61.8% weekly). It is followed by psychological $3,700 strengthened by 61.8% Fibo retracement monthly and the previous week’s low.
BTC/USD, 1D