- Bitcoin tumbles from $10,000; finds support above $9,000 as volatility returns to the crypto market.
- BTC/USD is likely to embrace consolidation before a breakout towards $10,000 comes into play.
Bitcoin price bulls were forced to endure a painful ride towards $9,000 in the wake of Thursday’s rejection from $10,000. The ascending trendline support on the daily chart could not stop the losses. BTC/USD spiraled below earlier support at $9,600. The bearish grip increased momentum, pushing the price below some key support areas at $9,400 and $9,200. Fortunately, buyers found their balance above $9,050, marking the end of the free-fall.
At the time of writing, Bitcoin is trading at $9,371 after conquering the resistance at $9,300. Its immediate downside is supported by the 50-day SMA. The 100-day SMA currently holds the position at $8,000 and would be vital in stopping dire declines if Bitcoin tanks under $9,000. On the upside, the price is preparing to face a tougher seller congestion zone at $9,400. Gains above this zone would give Bitcoin a clear path towards $10,000.
The technical picture from the daily chart shows the possibility of consolidation taking over in spite of the drop. However, a bearish divergence with the MACD signals that selling pressure cannot be ignored. In this case, establishing support above $9,300 would play a key role in the near term recovery towards the critical $10,000.
BTC/USD daily chart
-637275351173644556.png)
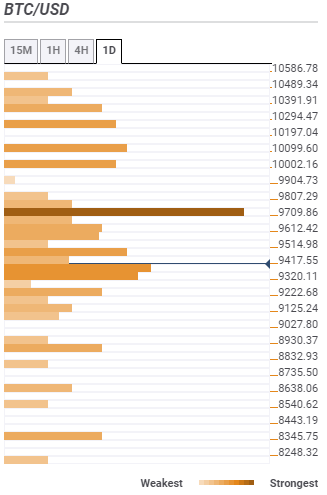
Bitcoin confluence resistance and support levels
Resistance one: $9,417 – The zone is highlighted by the previous high 15-minutes, the Bollinger Band 15-minutes upper curve, the SMA 200 4-hour and the previous high 4-hour.
Resistance two: $9,514 – The zone is home to the Bollinger Band one-day middle curve, the Fibonacci 38.2% one-day, SMA five 4-hour and the Bollinger Band one-hour upper curve.
Resistance three: $9,709 – This is the strongest resistance zone and is home to the Fibo 38.2% one-week, the SMA 200 1-hour, SMA 15-minutes, the Bollinger Band 4-hour middle curve and the SMA 100 1-hour among other indicators.
Support one: $9,320 – This initial support zone hosts the previous week low, the Fibo 23.6% one-day, SMA ten 1-hour, and SMA five one-hour.
Support two: $9,222 – Highlights the previous low 4-hour and the Bollinger Band 15-minutes lower curve.
Support three: $8,930 – Home to the pivot point one-day support one and the Fibo 61.8% one-month.