- BTC/USD consolidates in the middle of $10,000-$9,000 range.
- The strong resistance awaits BTC bulls on approach to $10,000.
Bitcoin (BTС) sits in a tight range limited by $9,550 on the downside and $9,650 on the upside. A collapse towards $9,119 low on Sunday proved to be short-lived and, potentially triggered by some positioning on crypto derivatives exchange BitMEX.
Read also: Bitcoin (BTC) price analysis: BitMEX long liquidation may be behind BTC/USD collapse
However, as the upside momentum remains weak, BTC is vulnerable to further losses during the day, unless the upper boundary of the above-said consolidation channel is taken out.
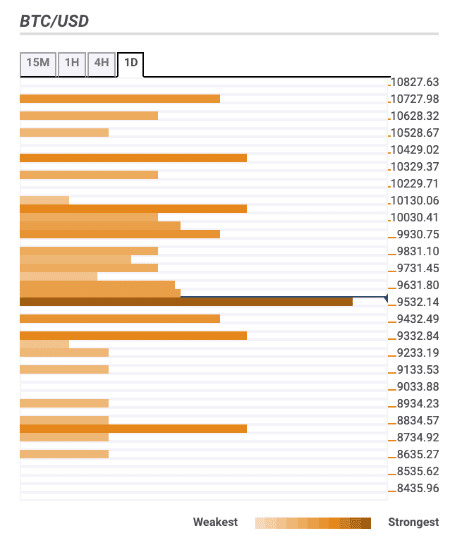
Bitcoin confluence levels
The market has calmed down as bulls are not happy with Bitcoin sitting under $10,000, and bears are not strong enough to take out $9,000.
The downside looks less crowded, though there are several significant support levels on the way to the South.
Let’s have a closer look at the barriers that might influence Bitcoin’s movements in the short run.
Resistance levels
$9,650 – the middle and the upper lines of 15-min Bollinger Band, the middle line of 4-hour Bollinger Band and the upper line of 1-hour Bollinger Band;
$10,000 – psychological barrier, SMA200 on 1-hour chart, SMA50 4-hour chart, Pivot Point day 1 Resistance 2, 38.2% Fibo retracement weekly;
$10,400 – SMA50 daily, 61.8% Fibo retracement weekly.
Support levels
$9,550 – 23.6% Fibo retracement daily, SMA10 4-hour, SMA100 15-min;
$9,300 – Pivot Point 1-week Support 1, 61.8% Fibo retracement daily;
$9,000 – psychological level.
$8,800 – Pivot Point 1-week Support 2, the lower line of 1-day Bollinger Band.