- The short-term bullish outlook for Bitcoin has been strengthened.
- The gains that had BTC hit a three-week high around $4,040 are partly backed by the high trading volumes.
BTC/USD cleared the resistance at $4,000 during the weekend trading marking the second biggest move in the same week. The short-term bullish outlook for the crypto has been strengthened. However, according to CoinDesk latest analysis, the four-week bull rally is currently facing former support that turned into resistance on several occasions in 2018.
Bitcoin closed the session yesterday on Bitstamp exchange at $3,965. The data shows that BTC/USD has increased by 1.73% in the last one week hence marking the fourth week the asset has been on an upward trajectory. The gains that had BTC hit a three-week high around $4,040 are partly backed by the high trading volumes that hit $10 billion last week. The volume has since thinned to levels around $8.6 billion at press time.
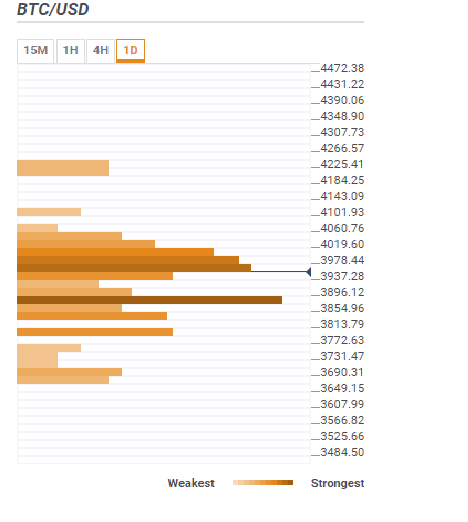
According to the confluence detector tool, the initial resistance lies at $3,978.44 and is host to several indicators include previous high 1-hour, previous high 15-minutes, Bollinger Band 15-minutes upper, 61.8% Fib retracement level daily chart, 10 SMA 1-hour, 10 SMA 4-hour, Bollinger Band 1-hour middle, 100 SMA 15-minutes, 5 SMA 4-hour, 50 SMA 1-hour.
Consequently, Bitcoin is still far from conquering the resistance at $4,000 let alone the critical hurdle at $4,236. While a sustained correction above $4,000 will be a step in the right direction the bulls will have to clear the resistance at $4,019.60. A level that is highlighted by a confluence of the following indicators the 161.8% Fibo weekly charts, the Bollinger Band 1-hour upper curve, and the pivot point 1-week R2.
On the flipside, initial support has been established at $3,937.28 with a confluence of indicators that includes the previous week high, 100 SMA 1-hour, previous low 1-day, pivot point 21-day S1. Second support has been established at $3,896.12 highlighted by the following indicators pivot point 1-week S3, 10-SMA daily chart, the 50 SMA 4-hour chart, and 200 SMA 1-hour chart.