- BTC/USD went down slightly from $8,811.45 to $8,750.50 this Wednesday.
- BTC/USD has three healthy resistance levels on the upside at $8,800, $8,990 and $9,000.
After suffering a slightly bearish Wednesday, wherein it fell from $8,811.45 to $8,750.50, BTC/USD has had a bullish start to this Thursday and is currently priced at $8,768.85. Since the price is sandwiched between strong resistance and support levels, further growth might be hampered. On the upside, there are three healthy resistance levels at $8,800, $8,990 and $9,000. While on the downside, healthy support levels lie at $8,755 and $8,530.
BTC/USD Confluence Detector
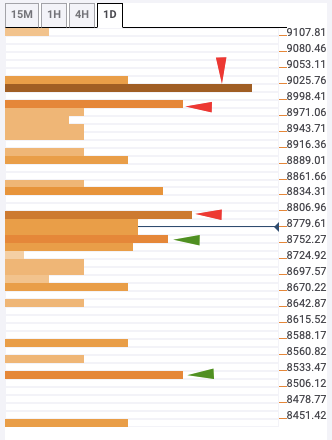
Looking at the resistance levels – $8.800 has the one-hour Previous High, 4-hour Bollinger Band middle curve, 15-min Bollinger Band upper curve, one-hour Bollinger Band upper curve, one-day Fibonacci 61.8% retracement level and 100-day Simple Moving Average (SMA 100), while $8,990 has no confluence detected. $9,000 has the 4-hour Bollinger Band upper curve and SMA 10.
On the downside, $8,755 has the SMA 5, SMA 10, SMA 50, SMA 100, SMA 200 and one-hour Bollinger Band middle curve. Finally, $8,530 has the one-month Fibonacci 61.8 retracement level.
