- BTC/USD is directionless, stays in the current range.
- A breakthrough in either direction will help to create momentum.
Bitcoin (BTC) seems to be paralyzed between $3,800 and $3,900. The largest digital coin has been sitting in the middle of the range since the beginning of the day amid slow trading activity. As volatility is non-existent, it is hard to say, where the price will move next. However, one thing is clear: a move above $3,900 is a precondition for an extended recovery.
BTC/USD the daily confluence detector
The resistance zone starts right above the current price and spreads to $3,920. This area contains numerous important technical indicators making it difficult for Bitcoin bulls to move on without an excellent stimulus.
The confluence of technical indicators include:
- Midline and the upper line of 1-hour Bollinger Band, the middle line boundary of 4-hour Bollinger Band, upper and middle line of 15-min Bollinger Band.
- A series of significant SMA levels including SMA200 and SMA100 (1-hour). SMA5 and SMA10 (4-hour) and a host of 15-min SMA levels.
- Fibo retracement levels (38.2% monthly, 23.6% weekly and daily)
Once this area is cleared, BTC/USD may proceed towards the next bullish aim at $4,000. This psychological level is strengthened by Fibo 23.6% monthly and a Pivot Point 1-day Resistance 3.
Once BTC makes its way above this area, the path to critical near-term resistance $4,150-$4,200 will be clear. There are few technical levels that can stop the ball once it starts rolling.
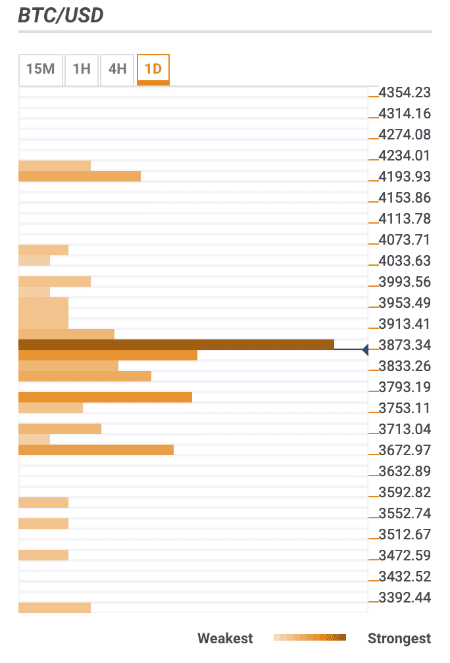
Below the current price, there is a support area created by 38.2% Fibo retracement daily, the middle line of Bollinger band on a daily chart and a lower boundary of 1-hour Bollinger Band.
It is followed by SMA200 (4-hour) on approach to $3,750, DMA50 and 61.8% Fibo retracement monthly under $3,700.
BTC/USD, 1D