- Cryptocurrencies push on the brake pedal as Bitcoin retreats from new highs.
- Bitcoin still has the potential to recover and rise above the 2019 highs in readiness for the levels around $6,000.
BTC/USD bulls shined incredibly last week pulling Bitcoin above various key hurdles to break the previous highs and set new 2019 highs above $5,800. The hourly chart shows Bitcoin having retreated first into the range between $5,700 and $5,800 the later explored the region marginally before $5,600 before resuming the uptrend. It is clear that the swing moves have reduced and ranging prices are expected in the short-term.
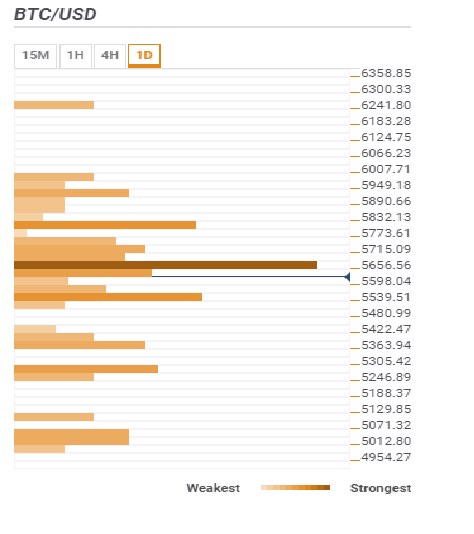
Bitcoin technical levels- Confluence Detector
The confluence detector tool provided by FXStreet shows that Bitcoin still has the potential to recover and rise above the 2019 highs in readiness for the levels around $6,000. However, for this to happen, the bulls must first clear the hurdles at $5,656.56 and $5,832.13. The confluence at these levels are:
$5,656.56: Previous low daily, 50 SMA 15′, 10 SMA 15′, previous month high, previous high 15′, 5 SMA 15′ pivot point daily S1, previous high hourly, Bollinger Band 4-hour, 23.6% Fib level daily, Bollinger Band 4-hour middle, 100 SMA 15′ and the 200 SMA 15′.
$5,832.13: Previous high daily, pivot point daily R1, previous week high and the Bollinger Band 4-hour upper.
If the current consolidation culminates in losses after a reversal, bulls can expect to find refuge at $5,539.51, $5.363.94 and $5,071.32 whose confluence levels are:
$5,539.51: Pivot point daily S2, Bollinger Band 1-hour lower, previous low 4-hour, Bollinger Band 4-hour lower and the 38.2% Fib level weekly.
$5.363.94: 100 SMA 4-hour, 10 SMA daily, Bollinger Band daily middle and the 61.8% Fib level weekly.
$5,071.32:38.2% Fib level 1-minute.