- BTC/USD climbs back above $3,800.
- A move above $3,800 mitigated bearish pressure.
BTC/USD staged a recovery from the recent low reached at $3,672. The coin touched $3,882 on Tuesday before entering another consolidation pattern. A flag formation of 1-hour chart signals that the upside may be resumed; however, we will need to see a confirmation first.
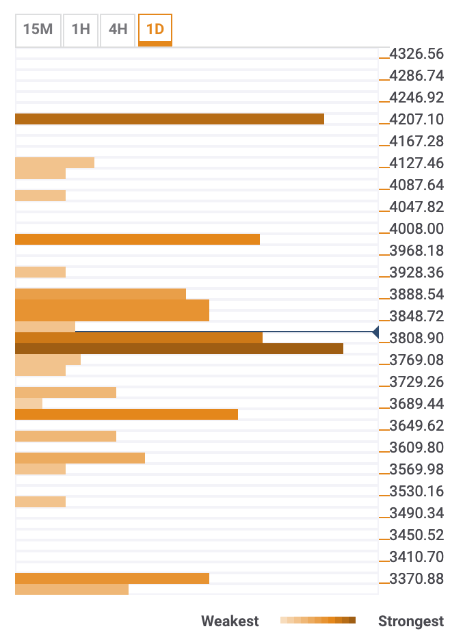
BTC/USD the daily confluence detector
The initial support area starts below the current price and goes down to $3,750. It is created by a confluence of strong technical indicators, including:
* SMA100 1hour
* SMA50 4hour
* SMA10 and SMA5 – daily chart
* SMA200 1hour
* Midline of 4hour and daily Bollinger Bands
* Upper line of 1hour Bollinger Bands
* 23.6% Fibo retracement weekly
* 38.2% Fibo retracement daily
Once this area is cleared, the sell-off may be extended towards $3,650 strengthened by the lower boundary of 4hour Bollinger Band, Previous Week Low and Fibo retracement 61.8% monthly.
A sustainable move below the said area will open the way towards $3,400 with Pivot Point 1week Support 2 and Pivot Point 1month Support 1 located below this barrier.
Above the current price, there is a resistance area created by a confluence of technical indicators, including DMA5, SMA100, 1hour, the midline of Bollinger Band 4hour and 23/6% Fibo retracement weekly.
The way to the North starts with a sustainable recovery above $3,800. This resistance is created by a confluence of technical indicators, including SMA100 1hour, SMA100 4hour, the upper line of Bollinger Bands on 1h-hour and 4h-hour intervals, 38.2% Fibo retracement weekly and monthly, and 23.6% Fibo retracement daily.
Basically, BTC/USD needs to move above $3,900 to receive a chance for an extended recovery towards psychological $4,000 with Fibo 23.6% monthly and 61.8% Fibo retracement weekly located marginally above this area.
BTC/USD, 1D