- BTC/USD went down from $11,535 to $11,385 as Monday came to a close.
- Daily confluence detector shows four healthy resistance levels upfront.
Following a bullish Sunday, BTC/USD has had a bearish Monday. During the day, BTC/USD went down from $11,535 to 11,385. The digital asset has had a bearish start to the day, as the price has gone down further to $11,382. Looking at the hourly breakdown, we can see that the price has had a bearish start to the day, as the price fell from $11,535 to $11,315. The bulls then managed to pick the price back up to $11,436, before it corrected to $11,385. The daily confluence detector shows that there are four healthy resistance levels upfront and there is only one support level of note on the downside.
BTC/USD daily confluence detector
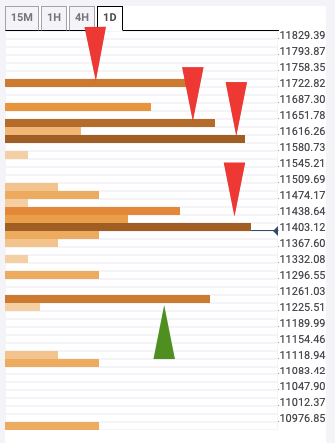
The four resistance levels are at $11,415, $11,600, $11,640 and $11,745. $11,415 has the 5-day simple moving average (SMA 5), SMA 10, SMA 100, 15-min previous high and 1-day Fibonacci 38.2% retracement level. $11,600-level has the 1-day previous high, while the $11,640-level has the 1-month Fibonacci 61.8% retracement level. Finally, $11,745-level has the 1-day pivot point resistance 1 and SMA 5.
On the downside, the only support level of note is at $11,250, which has the 1-day pivot point support 1 and 1-week Fibonacci 61.8% retracement level.
