- BTC/USD went from $8,240 to $8,692 this Friday.
- The daily confluence detector shows that the strongest resistance level lies at $8,725.
BTC/USD went up from $8,240 to $8,692, charting a 5.47% increase over Friday. The daily confluence detector shows us that if the bulls can gain enough momentum and go past the resistance level at $8,725, then the price may even cross past the $9,000 level for the first time since November 2018.
BTC/USD daily confluence detector
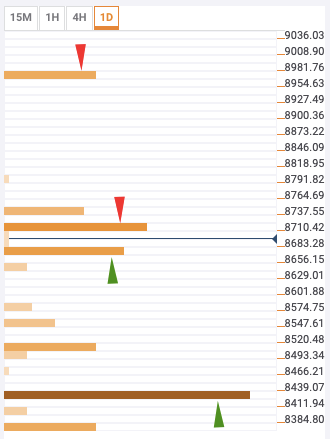
The support levels lie at $8,425 and $8,675. $8,425 sees the confluence of the 5-day simple moving average (SMA 5) curve, 4-hour previous low and weekly 23.6% Fibonacci retracement level. $8,675 has the hourly Bollinger band upper curve, SMA 10 and 1-day pivot point resistance 3.
The resistance levels are at $8,725 and $8,975. $8,725 has the previous week high and $8,975 has the daily Bollinger band upper curve.
