- Measured move on a descending triangle reveals Bitcoin price could decline to $17,329.
- IOMAP model reveals that Bitcoin is sitting on a relatively weak support.
Bitcoin price led a recovery rally for the cryptocurrency market on Wednesday after several coins reached the oversold zone on Tuesday. It is an optimistic price action for bulls after several bearish weeks. However, this does not mean that the downward bias has been reversed.
Investors have to wait for confirmation of a trend change for most of the assets to follow-through over the next trading sessions as former resistance levels are overcome.
Bitcoin Price Stares into the Abyss as 40% Losses Beckon
Bitcoin price has gained 7.7% over the last 24 hours as FOMO grips the cryptocurrency and stock marker following massive declines that were seen on July 20 on most crypto trading platforms.
The recovery has boosted BTC above the $30,000 psychological level and towards a resistance defined by a confluence of the 20-day simple moving average (SMA) at $32,900 and with the descending triangle’s hypotenuse resistance at around $33,200.
The descending triangle pattern is a bearish development for Bitcoin after weeks of holding support at $30,000. It implies that the demand for BTC is weakening and that the downward momentum is set to continue or even become stronger.
To initiate a breakout downwards, Bitcoin price needs to log a daily close below the $30,500 support level and slice through the horizontal trendline of the descending triangle tat around $30,000. These support areas are relatively weak since they have not been successfully defended since January 2021.
Bitcoin Price Daily Chart
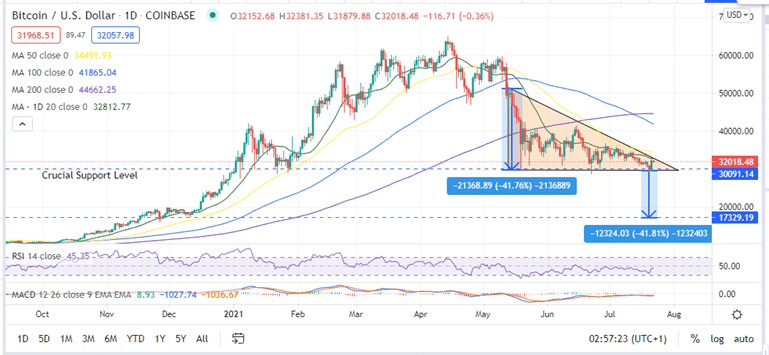
Based on the measured move of the descending triangle, Bitcoin price may move below the $30,000 and $20,000 support levels to reach a price target of $17,329, or lose 42% from the pattern breakout.
The Moving Average Convergence Divergence (MACD) adds credence to this bearish narrative by its position below the signal line in the negative region.
- Read our detailed guide to find out more about crypto signals.
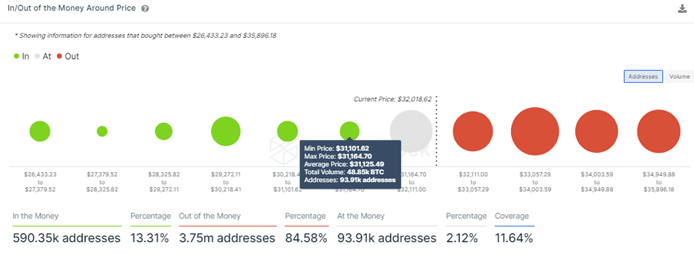
Insights from the IOMAP Model
On-chain metrics from the Into/Out of the Money Around Price model by IntoTheBlock indicate that Bitcoin price is currently sitting on a weak support between the $31,101 and $31,164 price range. At this range, only around 48,000 BTC have been previously been bought by approximately 94,000 addresses.
Bitcoin bulls need to defend this support zone (around $31,100) to make sure that more losses are not incurred.
On the other side, a daily closure above the $31,100 support level, the 20-day SMA at $33,100, the descending triangle downward trendline resistance at $33,500 and finally the 50-day SMA at $34,600 to ignite a sustainable rally upwards.
However, this will not be a walk in the park as the IOMAP model reveals that BTC currently faces massive resistance upwards.
Looking to buy or trade Bitcoin now? Invest at eToro!
Capital at risk
