- Bitcoin gradually welcomes consolidation after finding support above $9,600 (previous week resistance).
- BTC/USD is looking forward to another catalyst to forge a rising triangle breakout targeting $10,400 level.
Earlier this week Bitcoin bulls woke up from their slumber, impressively pushing the price closer to $10,000. The breakout was supported by speculation that arose due to reports that PayPal, a leading payments network was considering support for cryptocurrencies, especially Bitcoin. The impact of the news was supported by increased volume where Bitcoin spiked above $9,600 (previous week hurdle). Unfortunately, the momentum was not strong enough to take down the seller congestion zone at $9,800; a move that left $10,000 untested and of course unconquered.
Meanwhile, Bitcoin has retreated into the $9,600 range and is trading at $9,644. The digital asset is facing consolidation within this range even as $9,600 stands out as a formidable support area. Technical indicators such as the RSI and the MACD are moving sidelong at 55 and 0.00 (midline) respectively. This is perhaps the reason behind the delay in gains towards $10,000 and the potential rising triangle breakout (see chart below).
For now, consolidation will continue to carry the day until Bitcoin finds a breakthrough above $9,700 which should also be supported by the right volume. On the flip side, in case sellers gain more power and dominance in the coming sessions, expect support from the 50-day SMA ($9,461.23), the triangle support trendline, $9,000 and the 100-day SMA ($8,287.50).
BTC/USD daily chart
-637285762810525081.png)
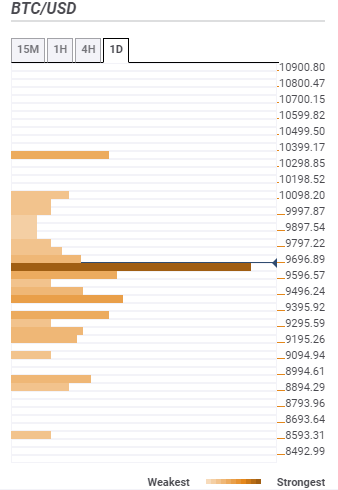
Bitcoin price confluence resistance and support levels
Resistance one: $9,696.89 – This region is highlighted by the SMA five 4-hour, the previous high 15-minutes, the Bollinger Band 15-minutes upper, the Fibonacci 61.8% one-day and the previous high 4-hour. There are mild resistance zones towards above $10,000 as well (see confluence chart below).
Resistance two: $10,399.17 – Converging in the area is the pivot point one-month resistance one and pivot point one-week resistance three.
Support one: $9,596.75 – This zone is home to the previous low one-day, previous week high, the SMA 200 15-minutes and the Bollinger Band 1-hour upper curve.
Support two: $9,496.24 – The SMA five one-day, SMA 100 1-hour, SMA 100 4-hour and the pivot point one-day support two meet in this area.