- Bitcoin recover to $100,000 and even reach millions of dollars.
- Bitcoin caught within a tight range between a strong support and acute resistance.
The major cryptocurrencies are likely to close the week in the red. The vulnerabilities threatening short-term support levels are still present. Although Bitcoin is trading above $3,800, it must correct higher to avoid further breakdown. Investors are starting to feel fatigued waiting for the largest asset to retrace the steps towards $4,000. The short-term outlook shows that Bitcoin trend is bearish.
However, a new survey shows that most investors in the industry believe that Bitcoin recover to $100,000 and even reach millions of dollars. The poll was conducted by a top author on TradingView: A charting site who has a Twitter following of more than 20,0000. The author referred to as MagicPoopCannon shared the results saying:
“The results are in! 42% of the 3,000 voters think BTC will reach into the $100,000 to Millions range, and 72% think BTC will surpass $20,000. Very nice.
For my long term view, I see Bitcoin going to at least $100,000 within four years. I think it could even reach $150,000 in that time. Eventually, I believe it could surpass $1,000,000. Where do you see BTC going in the long term?”
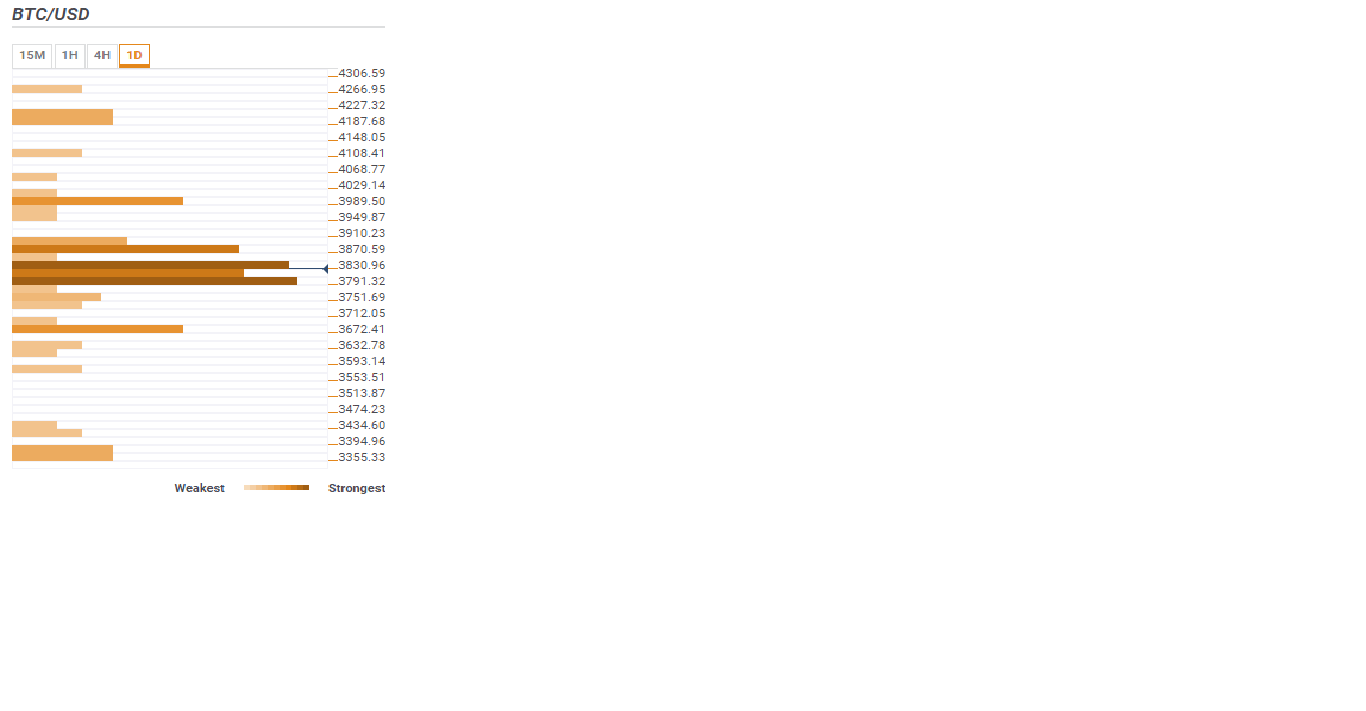
According to the confluence detector tool, Bitcoin is stuck in a tight range. There is strong support and at the same time acute resistance capping gains towards $3,900. Bitcoins needs to come out of this range and step above $3,900 in order to prevent declines that are likely to send it back to the drawing board below $3,500.
Initial resistance is limiting upward correction at $3,830.96 with a confluence of the previous high on the 1-hour chart, previous high on the 15-minuted chart, the 5-SMA 1-hour chart, the Bollinger Band 15′ Middle curve, the Bollinger 1-hour upper curve, 38.2% Fibonacci retracement level on the weekly chart and the previous high 1-hour chart. Another hurdle at $3,840.59 with a confluence of the 38.2% Fib level, 50-SMA 4-hour chart, the 10-SMA daily chart and the 200-SMA 1-hour chart. If Bitcoin makes it above $3,900, the move will ignite gains towards $4,000 and even open the road to $4,200 (medium-term resistance).
On the flipside, the strongest support is seen at $3,791.32 with a confluence of 10-SMA daily chart, 100-SMA 4-hour chart and the 23.6% Fib level daily chart. In case bears send Bitcoin below this position, Bitcoin could plunge further to the levels below $3,500.