- BTC/USD settled above $3,500 level amid quiet Asian hours.
- The downside is the path of least resistance at this stage.
Bitcoin is sitting in the middle of $3,600-$3,500 range amid directionless trading. While the price of the first digital coin has managed to recover from Sunday’s low at $3,481, the upside momentum is yet too weak to allow for a sustainable recovery towards critical $4,000. As there is no fundamental news that might have influenced the price, technical factors coupled with jitters ahead of Constantinople upgrade drive the market.
BTC/USD the daily confluence detector
The really strong support for BTC/USD lies with the lowest level of 2018 $3,127. This area, strengthened by Pivot POint 1-month Support 1, and layered with buy orders, creates a strong barrier for Bitcoin bears. However, the price will need to clear a number of weaker hurdles before it gets there.
Namely, Bollinger Band 4-hour Lower, Bollinger Band 15-min Middle, a host of SMA levels and 23.6% Fibo retracement level Daily lies right below the current price and limits the immediate downside pressure.
The next interim support is created by a confluence of technical indicators on approach to $3,400. They include Pivot Point 1-day Support 2 and 23.6% Fibo retracement monthly.
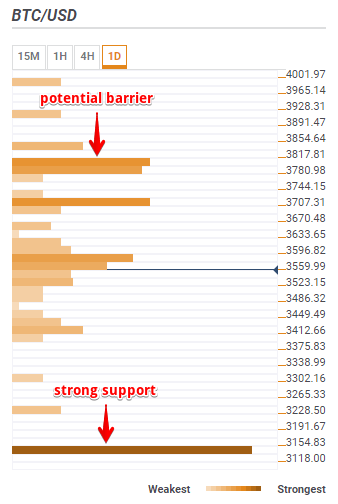
On the upside, the nearest resistance comes at $3,560. It is created by the previous week low and 38.2% Fibo retracement 1-month. A sustainable move above this area will provide an additional bullish impulse that may push the price towards a stronger hurdle at $3,700 with 23/6% Fibo retracement 1-week and Bollinger Band 4-hour Upper on approach.
A confluence of technical indicators clustered in the range from $3,780 to $3,820, is likely to prevent BTC/USD from moving towards the ultimate resistance at $4,000. These indicators include 38.2% Fibo retracement level Weekly, Pipot Point 1-day Resistance 3, a host of SMAs, including DMA50 and DMA10, and a Bollinger Band 1-day Middle.
BTC/USD, 1D