- BTC/USD dropped below the channel support.
- Fundamental developments enhanced the bearish sentiments.
- The technical indicators imply some rangebound trading.
The cryptocurrency market lived though a volatile week where a move towards fresh 2019 highs was followed by a sudden collapse. Notably, Bitcoin has come to the end of the week mostly unchanged, while all major altcoins are nursing substantial double digit losses. This development confirms the decoupling theory and emphasises Bitcoin’s haven status.
What’s going on in the market
This week has been packed with interesting fundamental developments, however, few of them influenced the market. Cryptocurrencies are more prone to speculative and technical factors, which makes them less predictable and less correlated with the traditional classes of assets.
Basically, there were two major negative developments that triggered the sell-off into the end of the week. First, India announced that it may introduce a complete ban on cryptocurrency trading. The government distributed the draft bill among the relevant committees and departments, While the final decision will be defined by their feedback, many authorities believe that “sale, purchase and issuance of all types of cryptocurrency” should have been prohibited much earlier.
In a separate development, the U.S. Securities and Exchange Commission (SEC) and the Commodity Futures Trading Commission (CFTC), issued a joint warning to investors. They urge the market participants to be extra careful when investing in the crypto sphere due to the high level of fraud.
However, the most powerful bearish trigger came from New York Attorney General’s (NYAG) office. According to the published document, iFinex, the company behind cryptocurrency exchange Bitfinex and Tether, may have defrauded NY cryptocurrency investors and engaged in money laundering activities.
It is not the first time Tether is involved in a scandal.
Meanwhile, Russia might create a regulatory sandbox in four separate regions to experiment with new technologies including blockchain and cryptocurrencies. This test period may seed up the process of adopting the appropriate legislation and taking the industry out of the grey area. Once this happens, more countries may follow the suit not to lag behind in this innovation rush.
BTC/USD, 1D chart
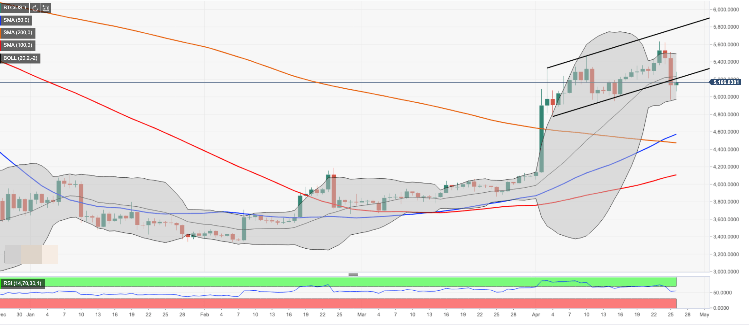
BTC/USD climbed as high as $5,632 and dived below $5,000 handle, This $600+ range may have been been nothing for the cryptocurrency market in 2017-2018, but it looks huge against the backdrop of non-existent volatility of 2019.
Unless something happens on the weekend, BTC/USD will break a series of bullish weekly closes for the first time since the end of March, which may bring some disappointment to the market. Traders and investors have started to think about crypto spring, but, just like the real spring it never comes overnight. We may still have a couple of frosty nights before it gets warm.
Looking technically, BTC/USD broke below the upside channel support, which is a nasty development, but the end of the world and not the end of the bull’s trend either. The downside correction may be extended towards $4,600 and $4,570 (DMA50) and to $4,470 (DMA200) before it’s time to get nervous. Moreover, the golden cross on a daily chart implies that the longer-term picture has improved.
The Relative Strength Index (RSI) both on weekly and daily timeframes remains flat and stays in a neutral zone, which implies a bit of slow motion within a range.
Meanwhile, the prices have stayed outside Bollinger Band (weekly) for the second week in a row. The upper boundary of the Band (currently at $5,220) now serves as a support level, in conjunction with a host of the technical indicators, including a midline of 1-day Bollinger Band and the lower boundary of the recent upside channel.
On the upside, we will need to see a sustainable move above $5,500 handle strengthened by the upper line of 1-day Bollinger Band.This development will negate the immediate bearish pressure and bring the recent high of $5,548 back in focus. It is followed by the channel resistance currently at $5,775.
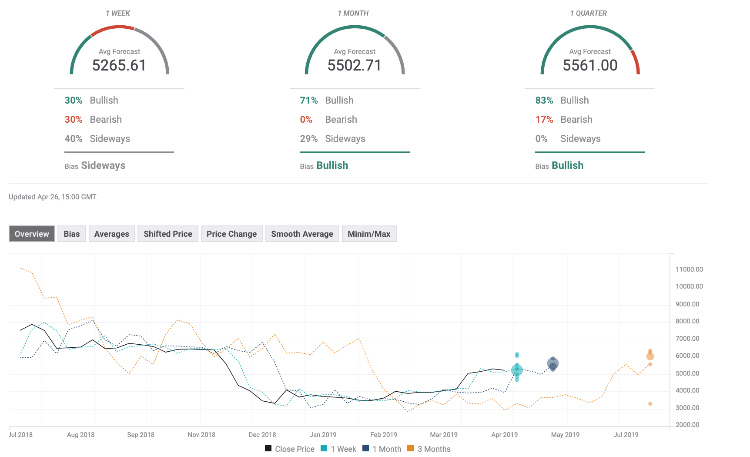
The Forecast Poll of experts improved since the previous week as expectations on midterm and long term timeframes are bullish. All price estimations are well above $5,000 handle.