- Bitcoin price appears to be consolidating in a choppy market
- BTC price squeezes on the Bollinger Bands to remain stranded between the $32,000 and $35,000 range.
- RSI and MACD confirm the consolidation with a possibility of a downward breakout.
The crypto market is generally struggling to stay afloat after attempts at recovery during the week. Bitcoin rose 1.48% over the last 24 hours, as bulls struggle to maintain an upward momentum after a significant downward rally on Thursday. This after exploring levels $32,000 and held support slightly above $31,500. Losses seem inevitable as investors continue shorting the market.
Similarly, crypto signals indicate that some articles are trading in the green, suggesting that some buyers are going for the smaller assets. For example according to Coinbase Stacks (STX) is up 18.56%, Chiliz (CHZ) is up 6.1% and Monero is up 2.1% over the last 24 hours.
Bitcoin 12-hour Price Ranges between $32,000 and $35,000
At the time of writing, Bitcoin was changing hands just above $33,000 on Coinbase. The price of the bellwether cryptocurrency is still sluggish and well off its all-time high price that was reached in April at around $65,000.
The sluggish Bitcoin price action experienced over the last three weeks teeters between highs of around $35,000 and a support at $32,000. This points to market consolidation which might continue over the next trading sessions.
The Bitcoin price consolidation is confirmed by the 12-hour Bollinger Band (BB). Bitcoin is currently trading near the middle line of the BB, indicating that the bullish and bearish pressure seems to be cancelling out.
Note that a breakout is likely to take place as the bands continue to draw inwards towards each other. If this happens, BTC price is likely to continue the downward trends and the largest cryptocurrency will be forced to retest the support at $30,000.
Bitcoin Price (BTC/USD)12-Hour Chart
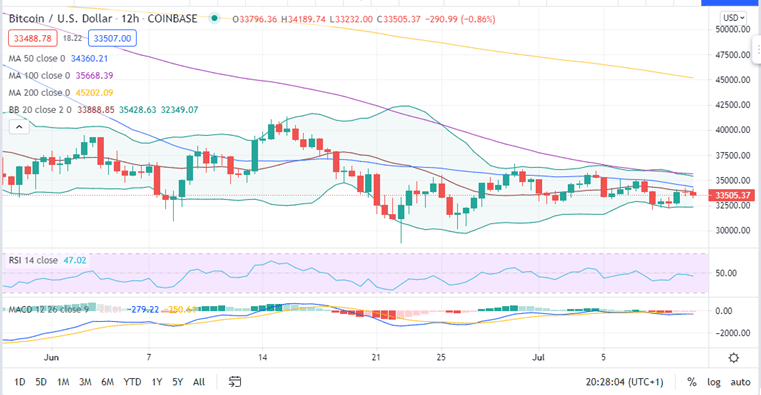
More Technical Indicators confirm the consolidation
A technical outlook from the Moving Average Convergence Divergence (MACD) indicator accentuates this price consolidation by it sideways movement. It also confirms the bearish outlook by its position below the zero line in the negative region.
Similarly, the RSI is downward sloping, an indication that the Bitcoin price is in downtrend and may eventually break below the lower band. Moreover, the RSI is typically in mid-range, which is a show of consolidation of the BTC price.
On the upside, Moving Average Convergence Divergence (MACD) may show a bullish signal in the next trading sessions. The call to buy will occur when the MACD line (blue) crosses above the signal line (orange) and will be confirmed once the MACD line crosses the mid-line into the positive area.
If this happens, BTC might close the day above the 50-day SMA at around $34,400, and continuation upwards could ensue until it meets a major resistance close to the 100-day SMA at $36,000.
To find out how to trade Bitcoin read our How To Buy Cryptocurrency guide details.
Looking to buy or trade Bitcoin now? Invest at eToro!
