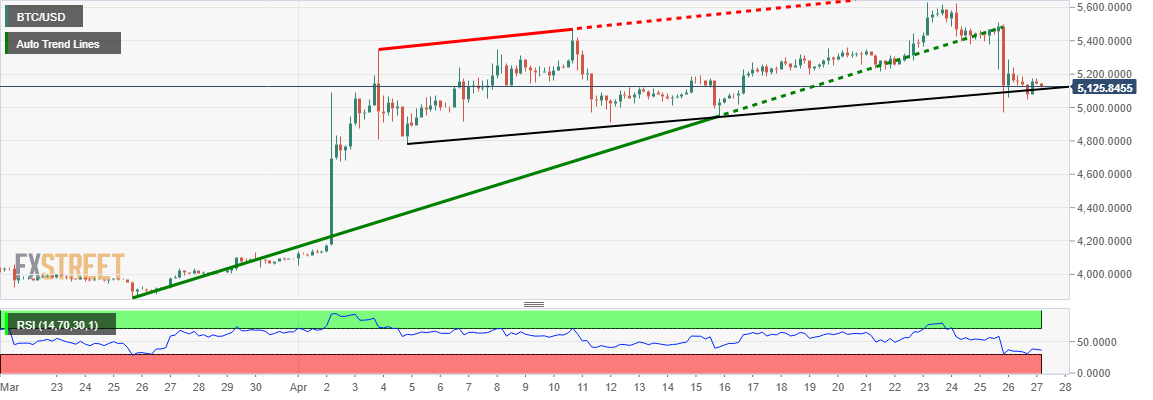
- BTC breaks down of a key trendline in the short term.
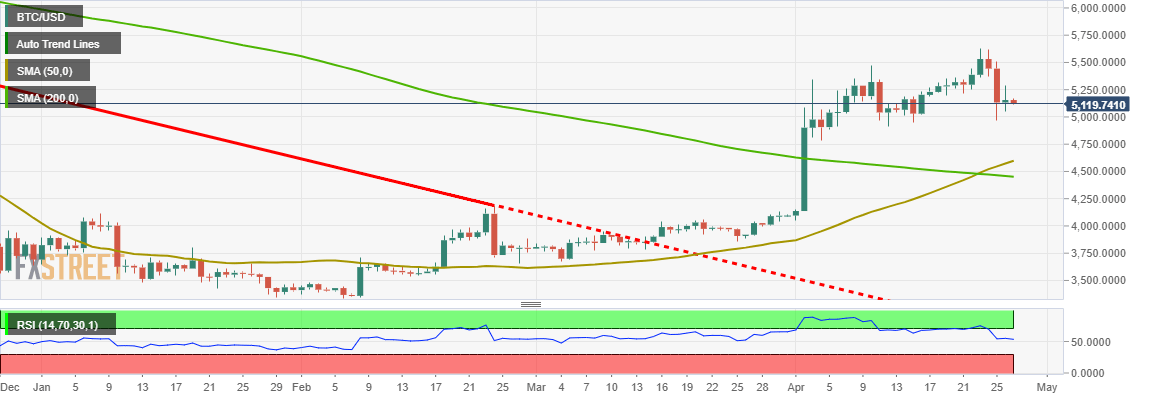
- Golden cross occurs just couple days before the breakdown
Bitcoin, the largest cryptocurrency by market capitalisation and the poster boy of the crypto world, sees a short term break down of prices from a key trendline support, leading all the other major coins to fall along with it, even as one of the most relied upon technical indicator points bullishness ahead.
BTC/USD is down four cents of a percent at $5,133, near the day’s low and trading in less than 1 percent of the day’s range. This low range is hallmark of a low volume weekend trading and also points towards exhaustion by the bears after the breakdown of a key trendline support on the 240-minute chart.
Irony is that, this breakdown has happened exactly after two days of the golden cross occurence on the daily chart, which is one of the most sought after and relied upon technical indicator by the bulls. Prices are now at another support line on the 240-minute chart, from where a meaningful bounce should be expected.
BTC/USD 240-minute chart:
BTC/USD daily chart: