After breaking above the $9,000 handle earlier in the week, Bitcoin (BTC/USD) pushed higher and touched its best level since late October at $9.570 on Thursday. However, the pair lost its traction and erased nearly 2% on Friday before starting to consolidate its losses on Saturday. As of writing, the pair was up 0.6% on the day at $9,385.
Technical outlook
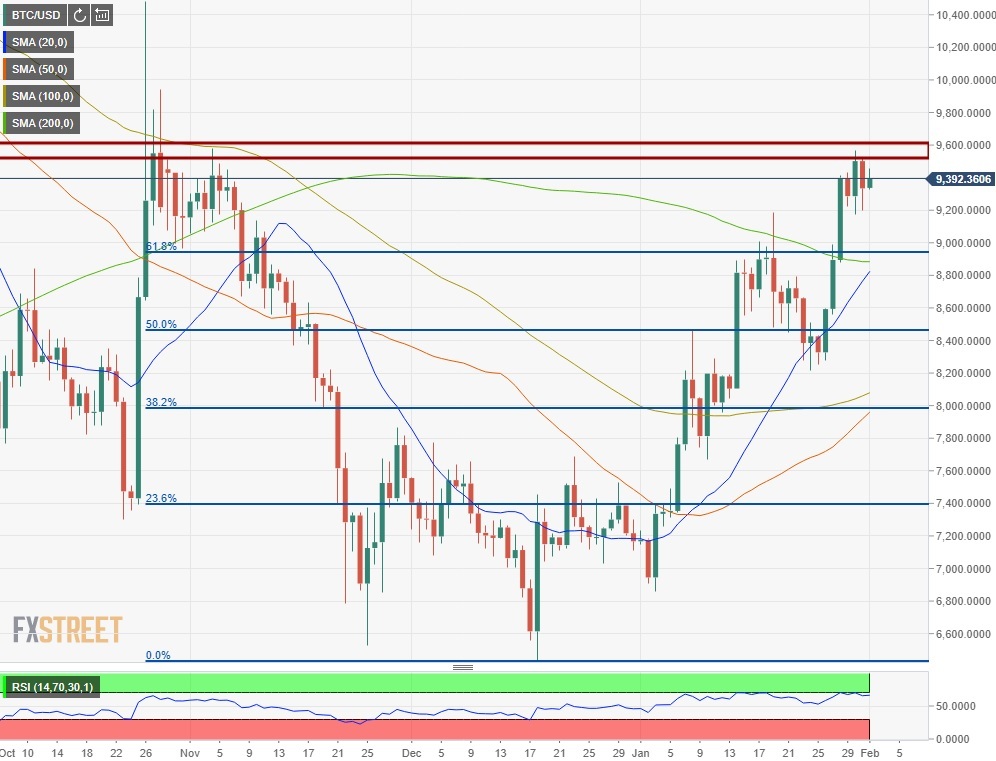
On the daily chart, the RSI indicator stays within a touching distance of the 70 mark, above which the pair would get technically overbought in the near-term. The bullish momentum seems to be weakening and the pair might need to stage a technical correction before the next leg up. On the other hand, the 20-day SMA continues to stay above the 50-day and the 100-day SMA and is looking to make a bullish cross with the 200-day SMA, suggesting that the medium-term bullish outlook remains intact.
On the upside, $9,500 – $9,600 area (static resistance, Fibonacci %78.6 retracement of the Oct. 25 – Dec. 18 drop) aligns as a critical resistance that capped the pair’s upside throughout the week. With a decisive break above that level, the pair could target $10,000 (psychological level) and $10.400 (Oct. 26 high). Supports, on the other hand, could be seen at $9,000 – $8,900 (Fibonacci %78.6 retracement of the Oct. 25 – Dec. 18 drop, 200-day SMA) and $8,500 (Fibonacci %50 retracement of the Oct. 25 – Dec. 18 drop).
BTC/USD daily chart