- BTC/USD’s mid-week recovery remains shallow, sellers retake control of the price action with the daily RSI easing back to the 40 mark.
- Only a daily close above $6800 (critical Fibo resistance) could neutralize the short-term bearish outlook.
- A decisive break below $6000 could open the door to new 2018 low.
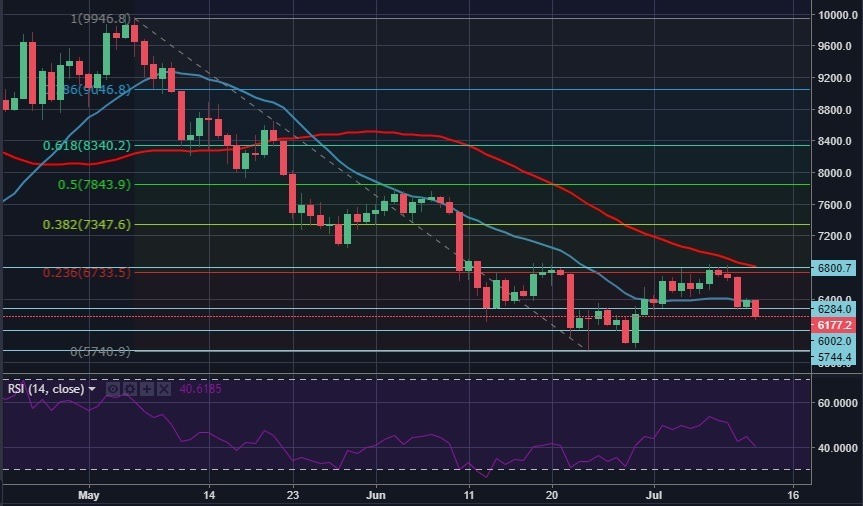
Spot rate: 6180
Relative change: -3%
High: 6377
Low: 6128
Trend: Bearish
Support 1: 6000 (psychological level/static support).
Support 2: 5750 (2018 low/Jun. 24 low).
Support 3: 5500 (Oct. 24, 2017, low).
Resistance 1: 6370 (50-DMA).
Resistance 2: 6800 (Fibo. 23.6% retracement of May 6 – Jun. 24 fall).
Resistance 3: 7350 (Fibo. 38.2% retracement of May 6 – Jun. 24 fall).
