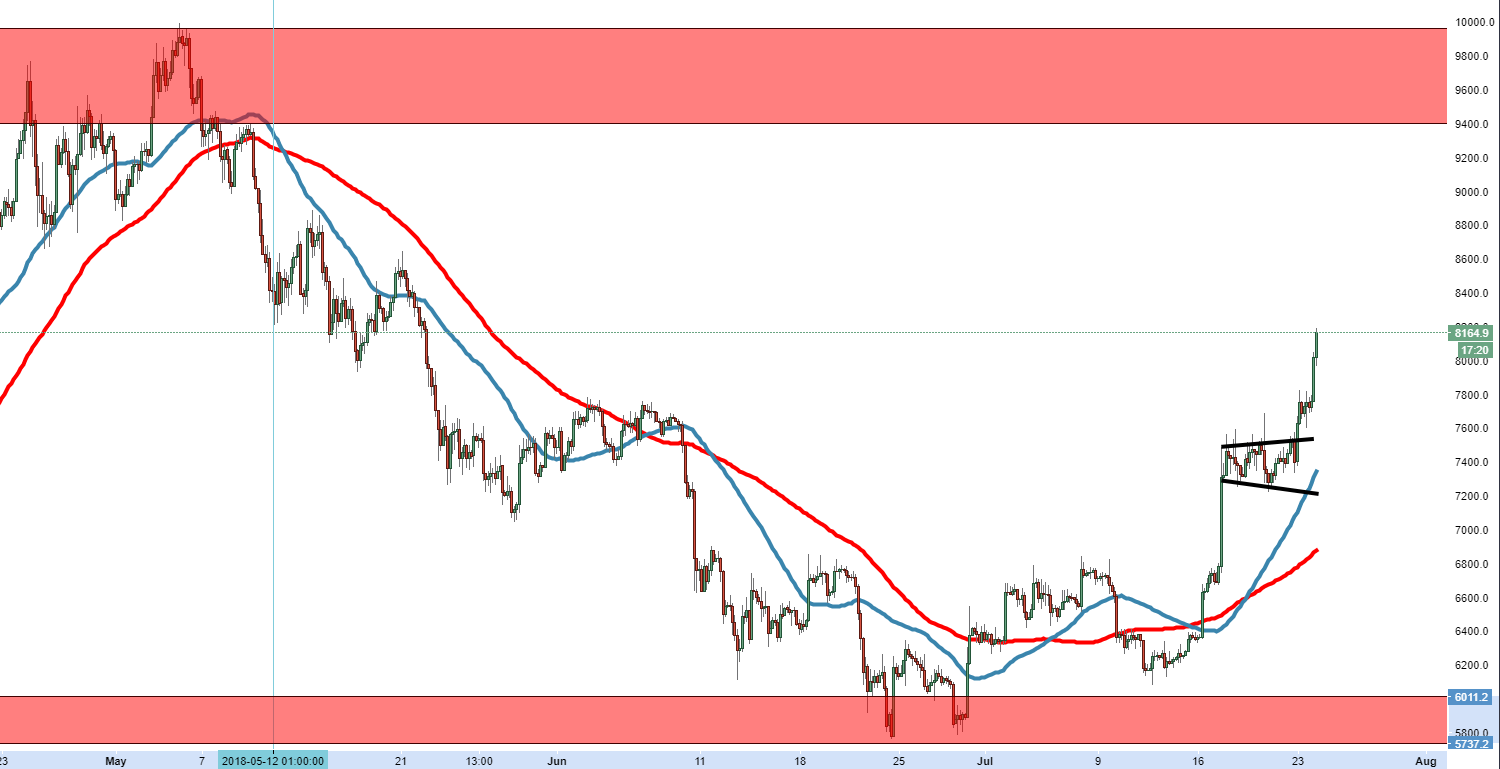
- Bitcoin price has run riot on Tuesday, gaining as much as 6% in the early part of the session.
- BTC/USD extending its move to the north, following the breakout on Monday from a bull flag pattern.
- Next major area of interest will be seen around the $9500 territory, last traded here in May.
BTC/USD 4-hour chart
Spot rate: 32.80.
Relative change: -2.60%.
High: 34.68.
Low: 32.20.
Trend: Bullish.
Resistance 1: 8278.0, consolidation area 18th May.
Resistance 2: 8360.9, (resistance on 4-hour chart), consolidation area 17th May,
Resistance 3: 8473.4, 17th & 19th May high.
Support 1: 7751.1, 7th June high and supply area.
Support 2: 7544.0, on top of broken bull flag pattern.
Support 3: 7360.4, 50MA and demand area.
