- Bitcoin nursing minor losses in the early part of trading on Friday, down just some 1.6%.
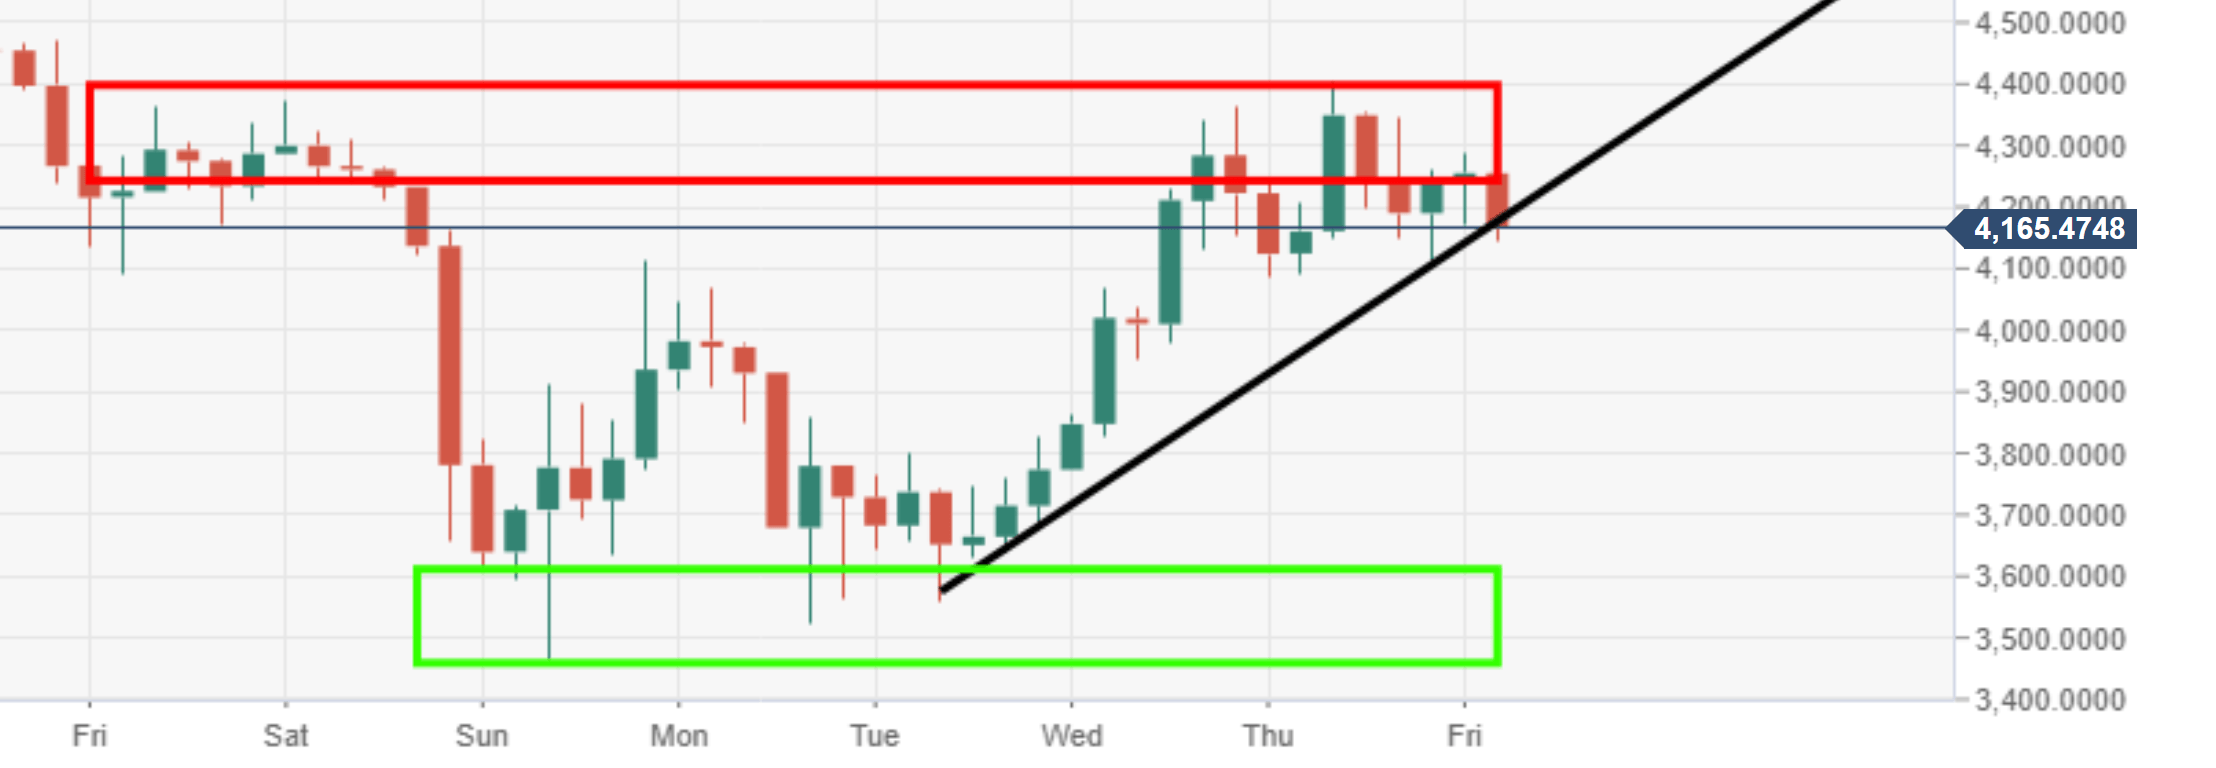
- BTC/USD is testing an ascending trend line to the downside. At risk of a breach.
- Should the above mentioned support give way the price could easily fall down to retest $3500.
BTC/USD 4-hour chart
Spot rate: 4169.71
Relative change: -1.63%
High: 4398.23
Low: 4149.66
Trend: Bearish
Support 1: 4150.00, ascending trend line.
Support 2: 4088.24, daily pivot point support.
Support 3: 3930.33, daily pivot point support.
Resistance 1: 4404.27, daily pivot point resistance.
Resistance 2: 4562.39, daily pivot point resistance.
Resistance 3: 4720.30, daily pivot point resistance.
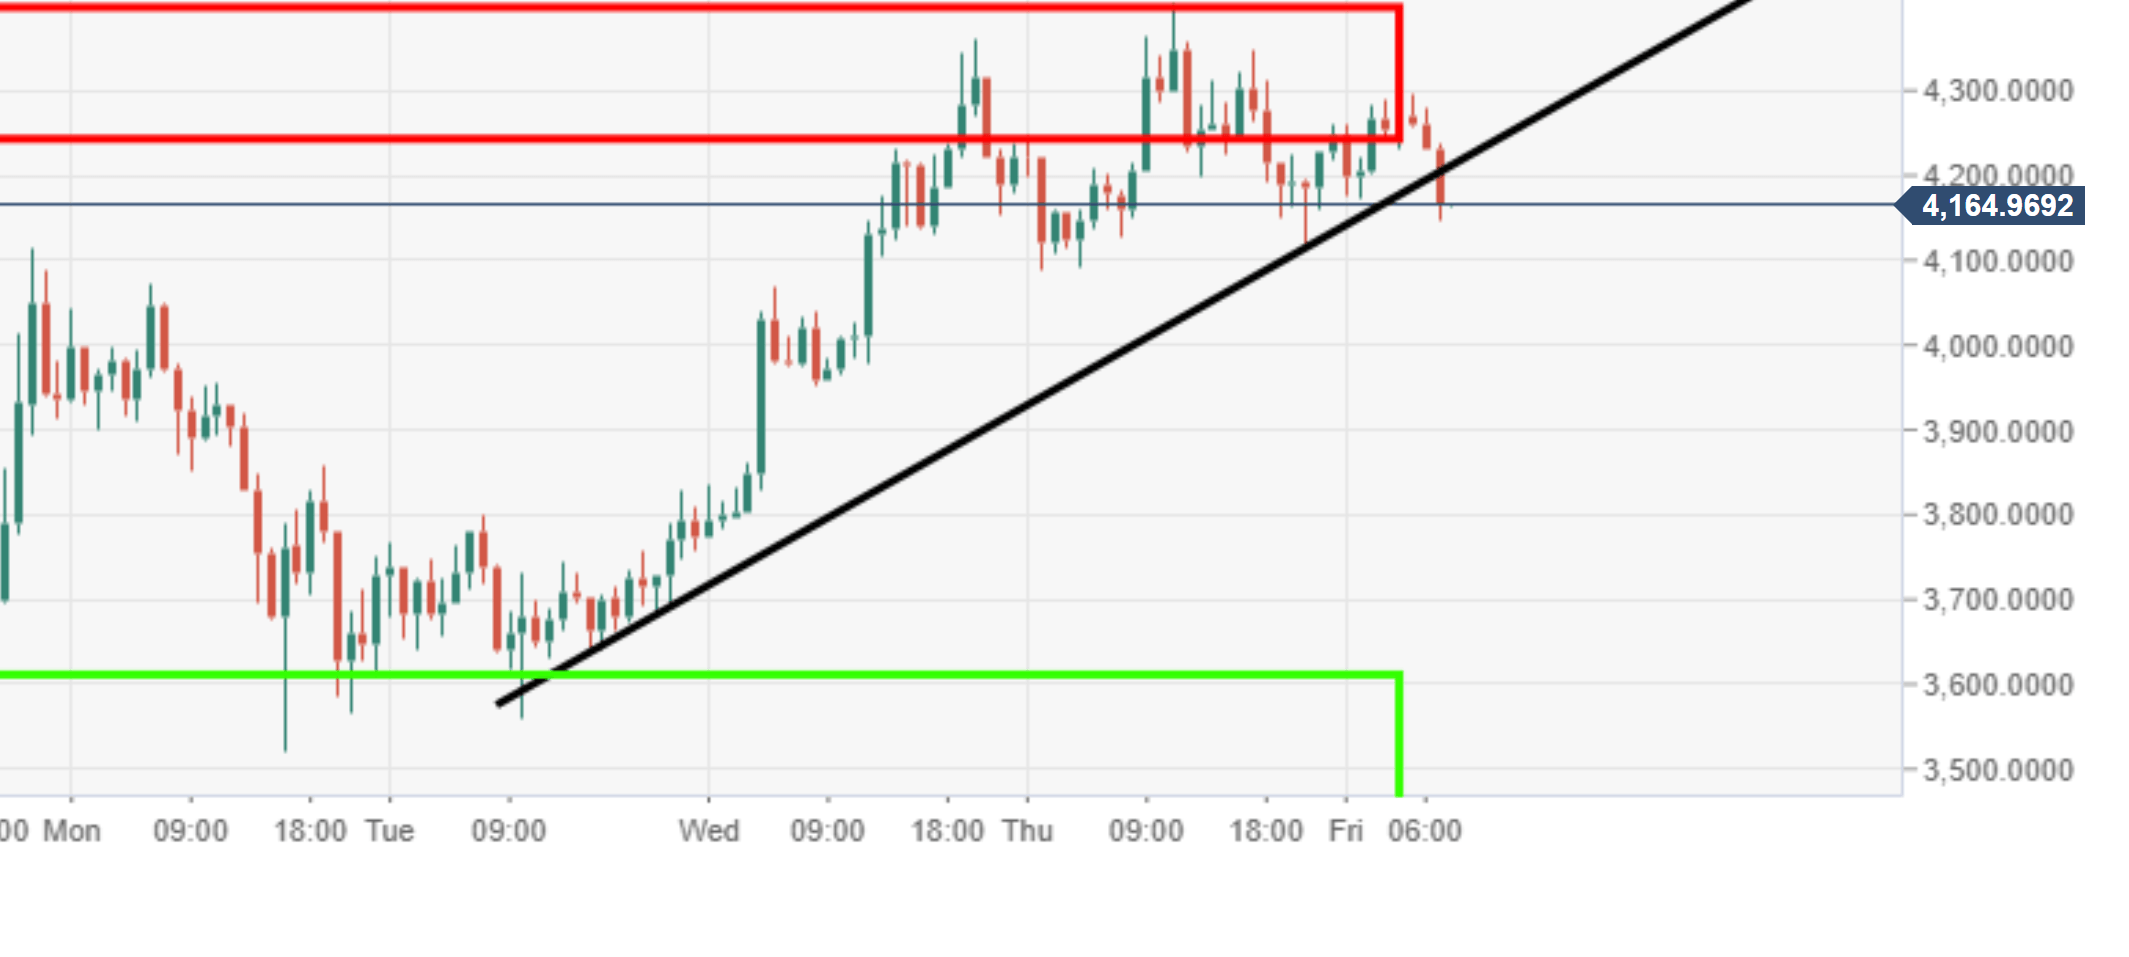
BTC/USD 60-minute chart
- BTC/USD can be seen testing the supporting ascending trend line to the downside, risk of breach.