- Bitcoin price on Thursday trading ever so marginally in the red, down some 0.10%.
- BTC/USD moving within a range-block formation seen via the daily.
BTC/USD 15-minute chart
- Range-block trading, price very much confined within, vulnerabilities to the downside remain.

Spot rate: 3363.50
Relative change: -0.10%
High: 3381.56
Low: 3360.10
Trend: Bearish
Support 1: 3323.24, daily pivot point support.
Support 2: 3279.26, daily pivot point support.
Support 3: 3219.54, daily pivot point support.
Resistance 1: 3426.94, daily pivot point resistance.
Resistance 2: 3486.66, daily pivot point resistance.
Resistance 3: 3530.64, daily pivot point resistance.
BTC/USD 60-minute chart
- Price action has formed a bearish flag pattern formation, subject to further downside risks.

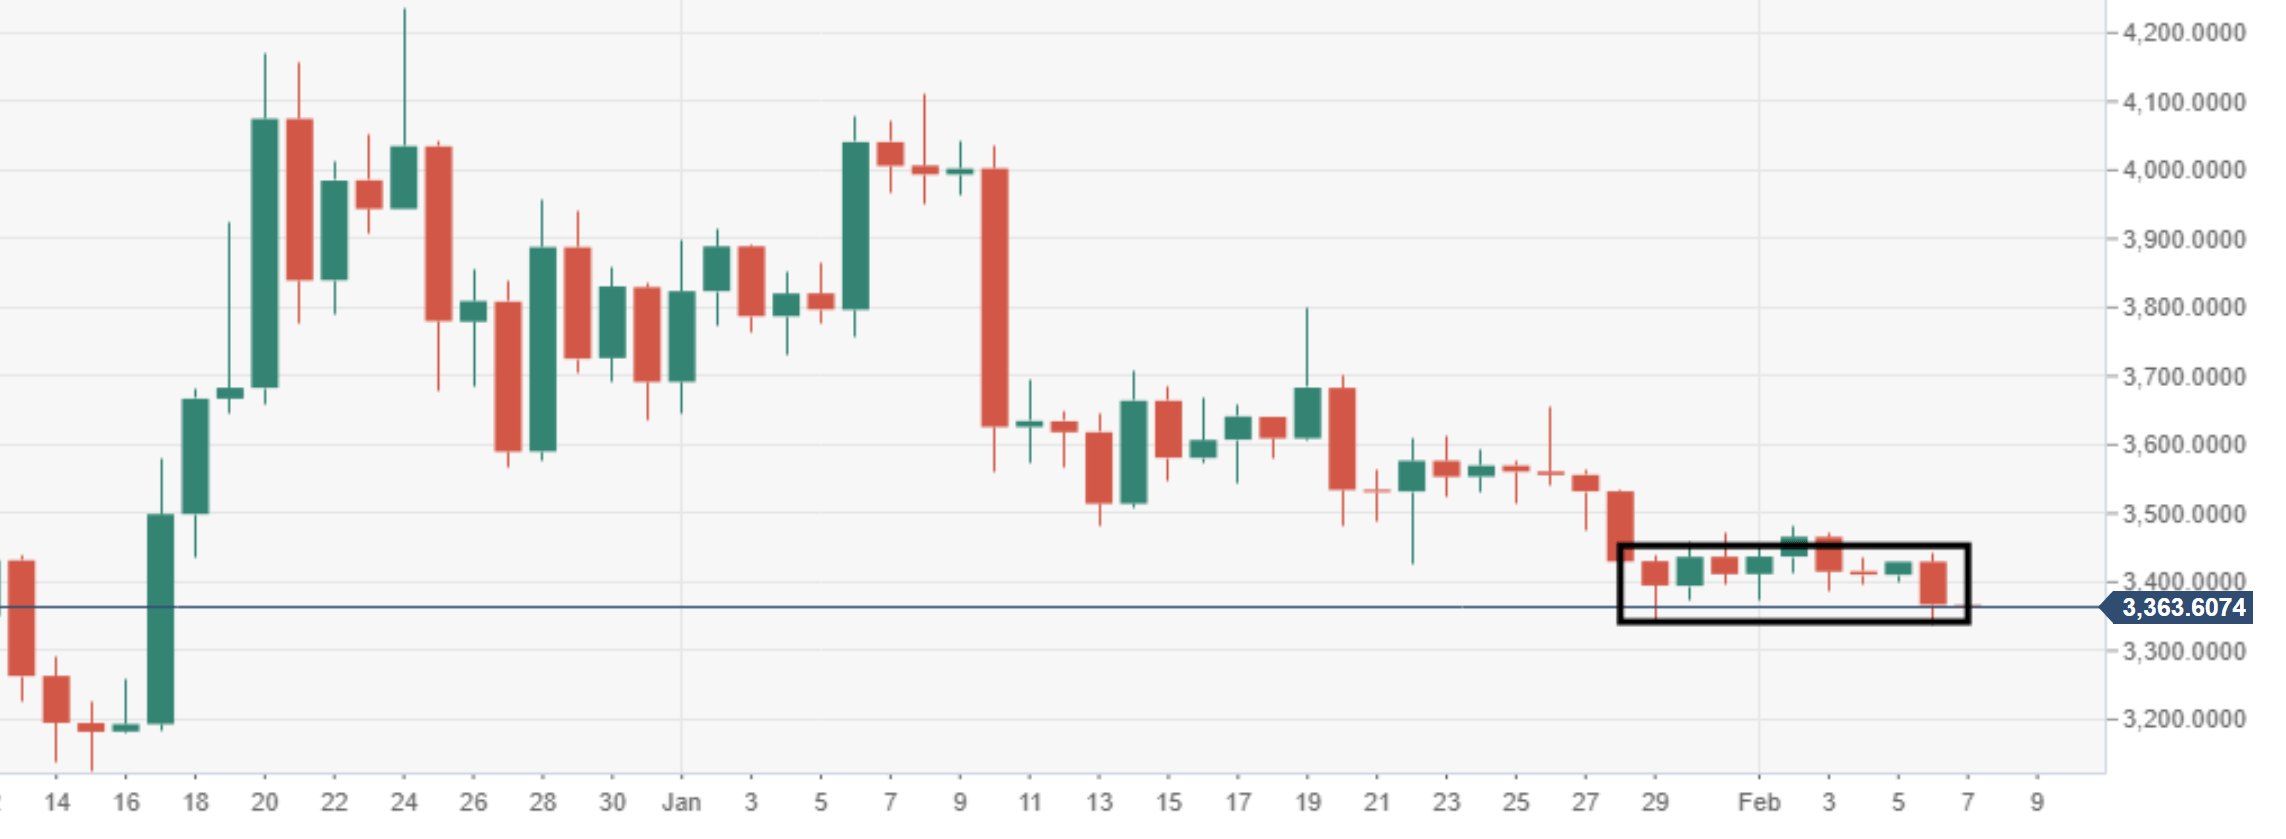
BTC/USD daily chart
- Price action continues to move within a range-block formation structure.