- Bitcoin price is trading in negative territory, down some 1.50% in the second half of the session.
- BTC/USD vulnerable to a fresh wave of selling pressure should daily support at $8000 be broken.
- Price action is largely tilted to the downside, as the sellers maintain control.
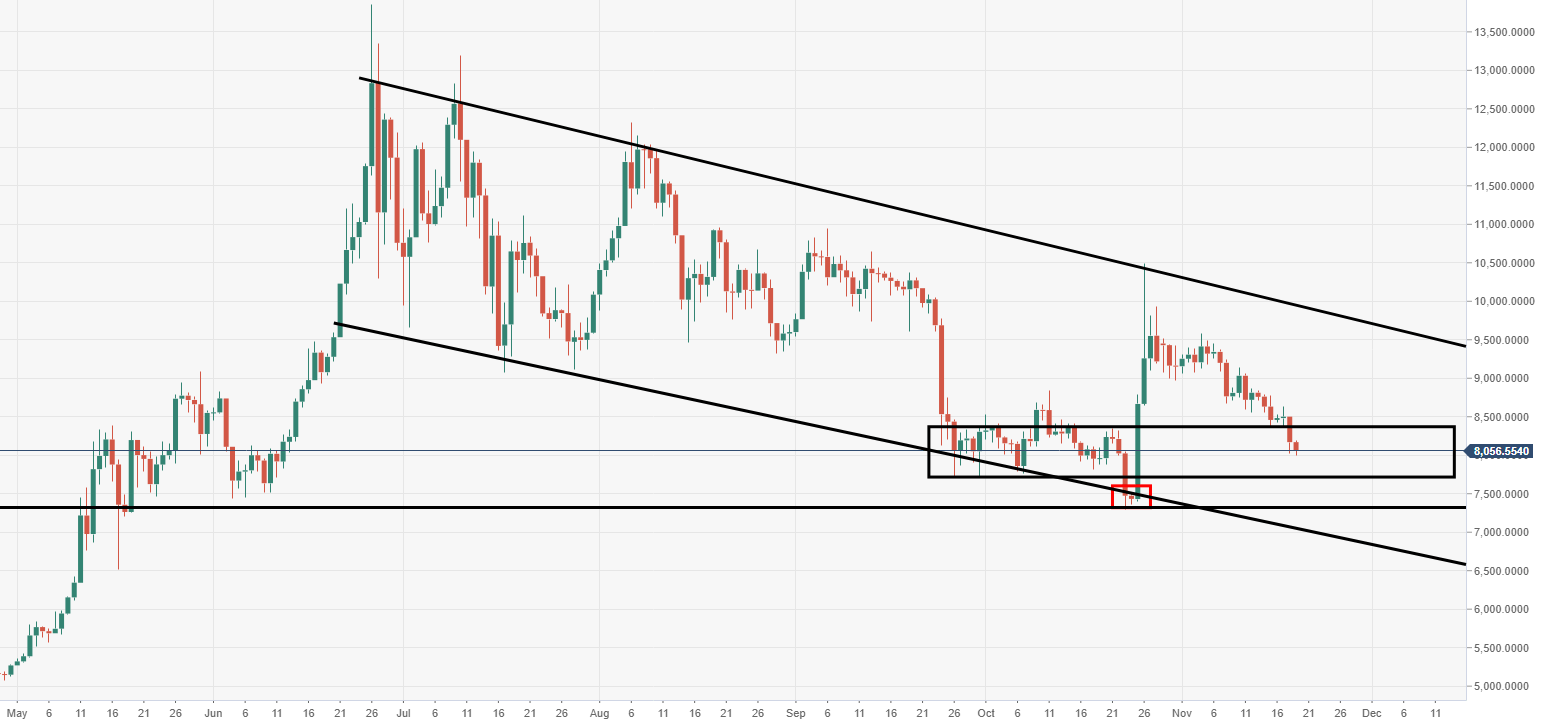
BTC/USD daily chart
The bears are testing the psychological $8000 mark to the downside. Failing of this holding could see a fast fall down to $7300 and then $7000.
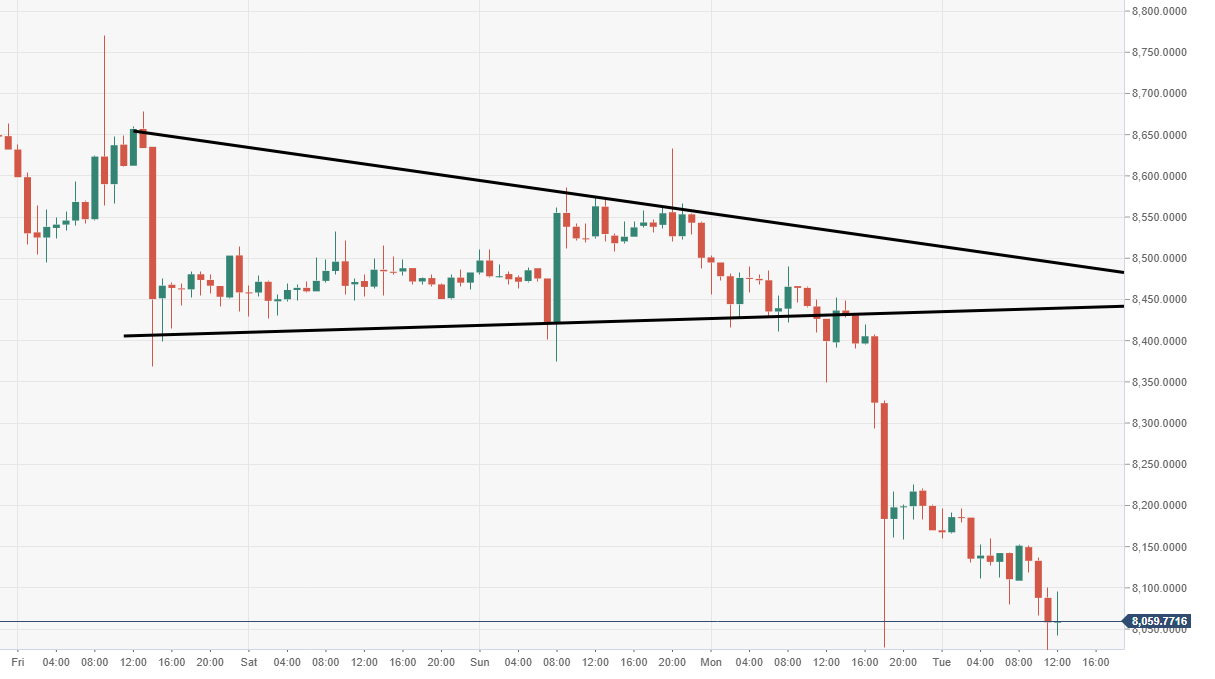
BTC/USD 60-minute chart
An extended move to the downside came as the bears broke out of a bearish pennant structure via the 60-minute.
Spot rate: 8,074.86
Relative change: -1.50%
High: 8,196.38
Low: 7,990.61
