Home Bitcoin Technical Analysis: BTC/USD bears manage to force the price below of a near-term supporting trend line, how deep of a pullback is the question now
Crypto News

Bitcoin Technical Analysis: BTC/USD bears manage to force the price below of a near-term supporting trend line, how deep of a pullback is the question now

  • Bitcoin was seen holding modest gains on Thursday, some 0.5% currently in the first half of the session.  
  • BTC/USD price has been forced by the market bears to dip below an ascending trend line, that had been supporting the recent upside price action.  


BTC/USD 15-minute chart
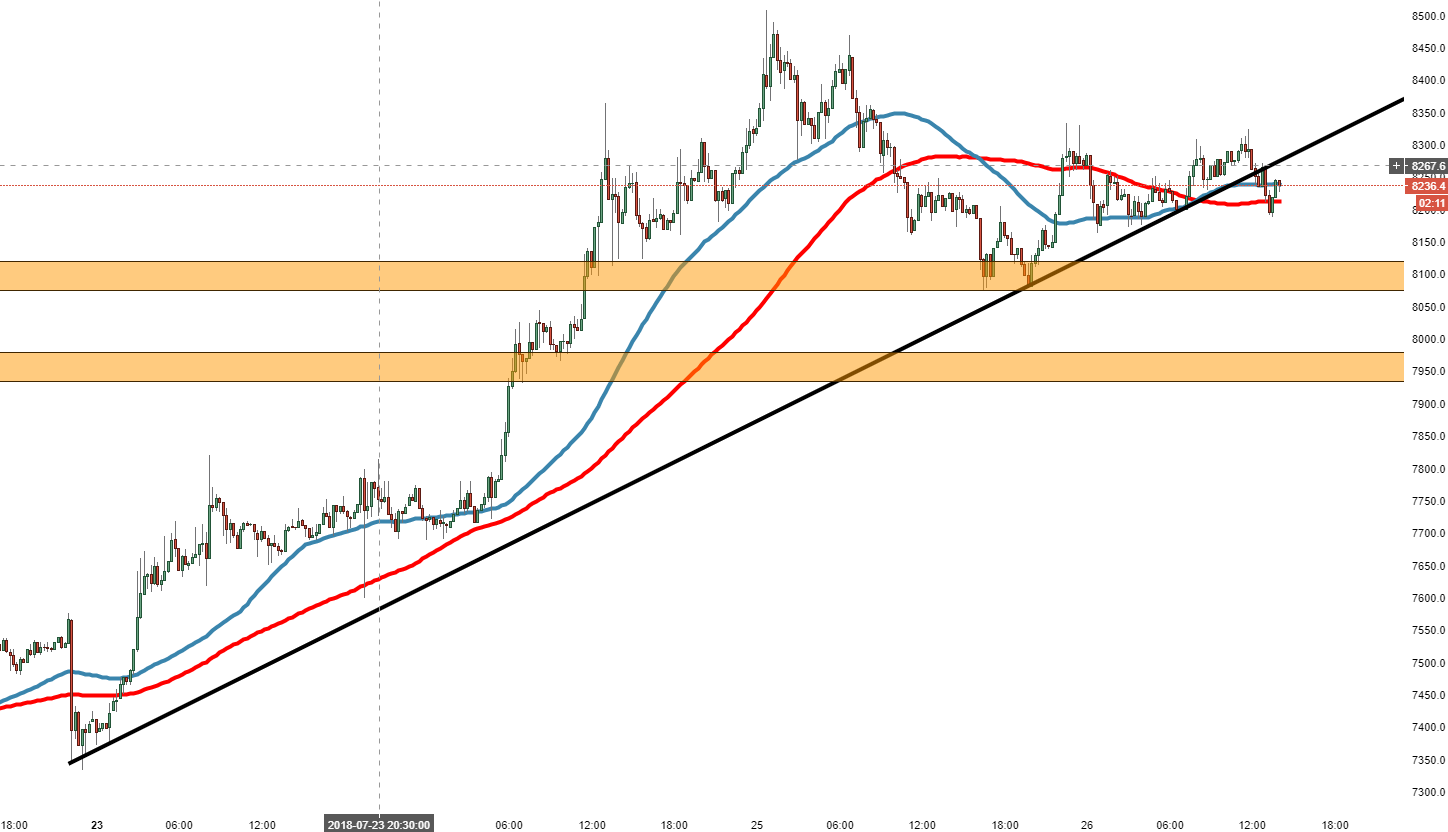
 

Spot rate:                  8228.5

Relative change:        +0.55%

High:                          8323.1

Low:                           8172.5


Trend:                         Neutral


Support 1:                 8215.0, 100MA.

Support 2:                  8172.5, today’s (Thursday) low & support on 15-minute chart.

Support 3:                  8120.0, demand zone entrance.

Resistance 1:             8275.5, below the broken ascending trend line.  

Resistance 2:             8305.0, (resistance on 15-minute chart).

Resistance 3:             8323.1 today’s (Thursday) high.


FX Street

FX Street

FXStreet is the leading independent portal dedicated to the Foreign Exchange (Forex) market. It was launched in 2000 and the portal has always been proud of their unyielding commitment to provide objective and unbiased information, to enable their users to take better and more confident decisions.