- Bitcoin price is trading in negative territory, down some 0.80% in the second half of the session.
- BTC/USD vulnerable to a fresh wave of selling pressure should daily support at $8400 be broken.
- Price action is tiltied to the downside after a big fall through $9000 support.
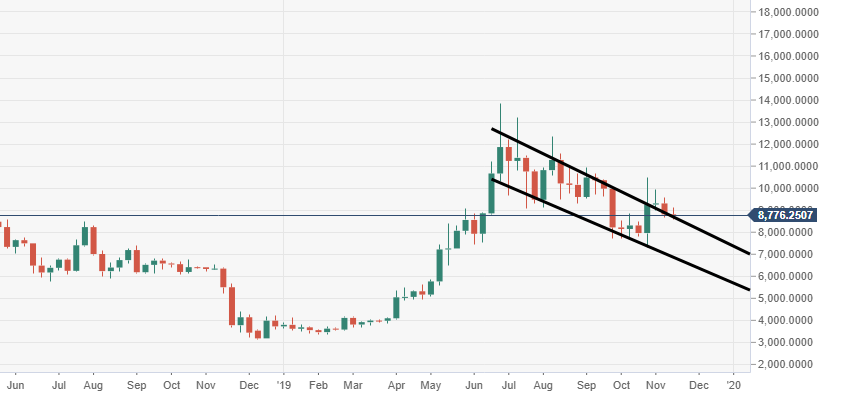
BTC/USD weekly chart
Next major critical weekly support to the downside is eyed back at the $7800 price territory. A descending channel structure can also be observed via the weekly view.
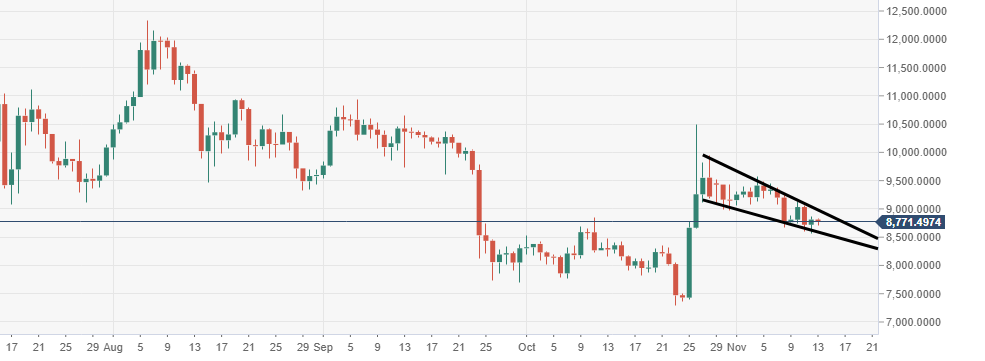
BTC/USD daily chart
The price is subject to losing the $8000 territory, as the bears maintain control.
Spot rate: 8,582.61
Relative change: -0.80%
High: 8,502.75
Low: 8,411.01
