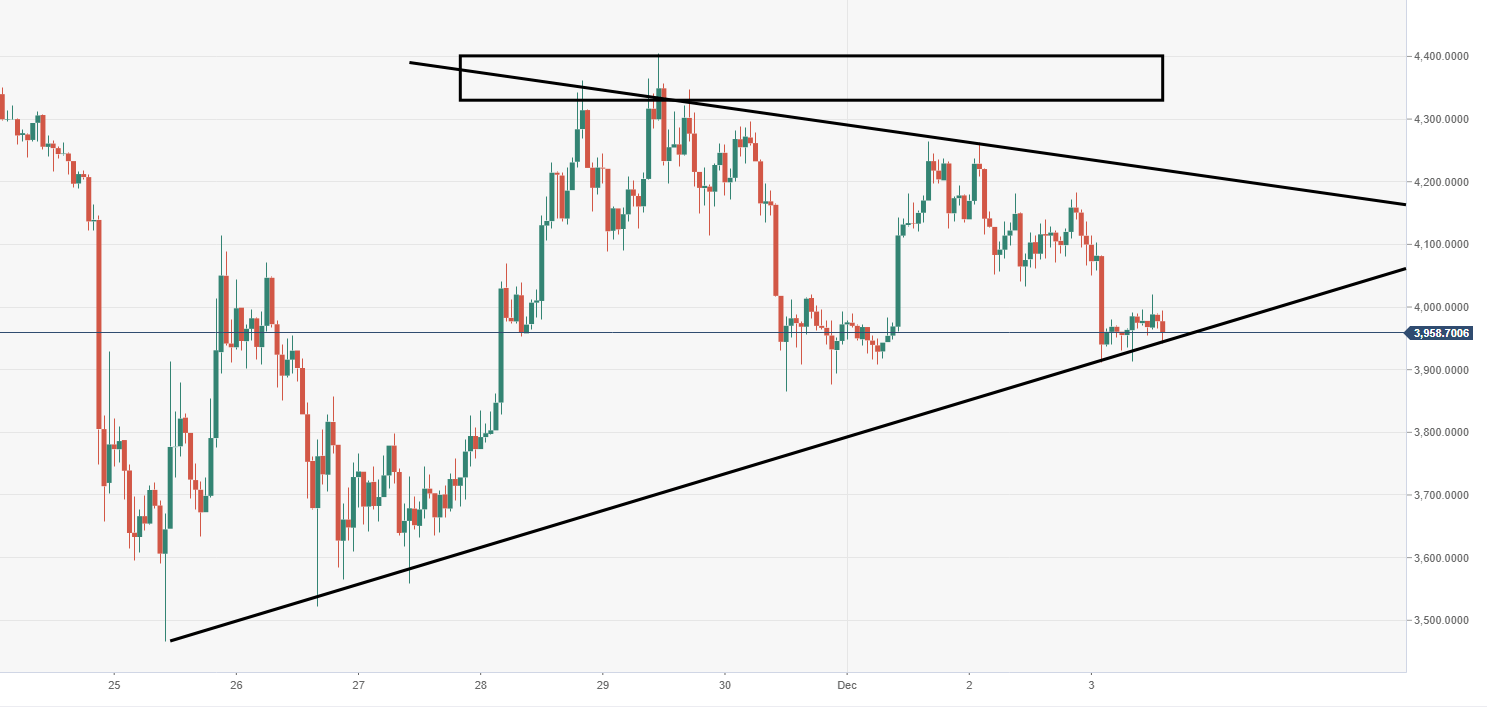
- Bitcoin price on Monday was seen flirting with the $4000 mark, as lack of commitment continues to plague the market.
- BTC/USD price action is narrowing again, which suggests another big breakout could be right round the corner.
- A triangular pattern formation has been observed via the 4-hour chart view.
BTC/USD 4-hourchart
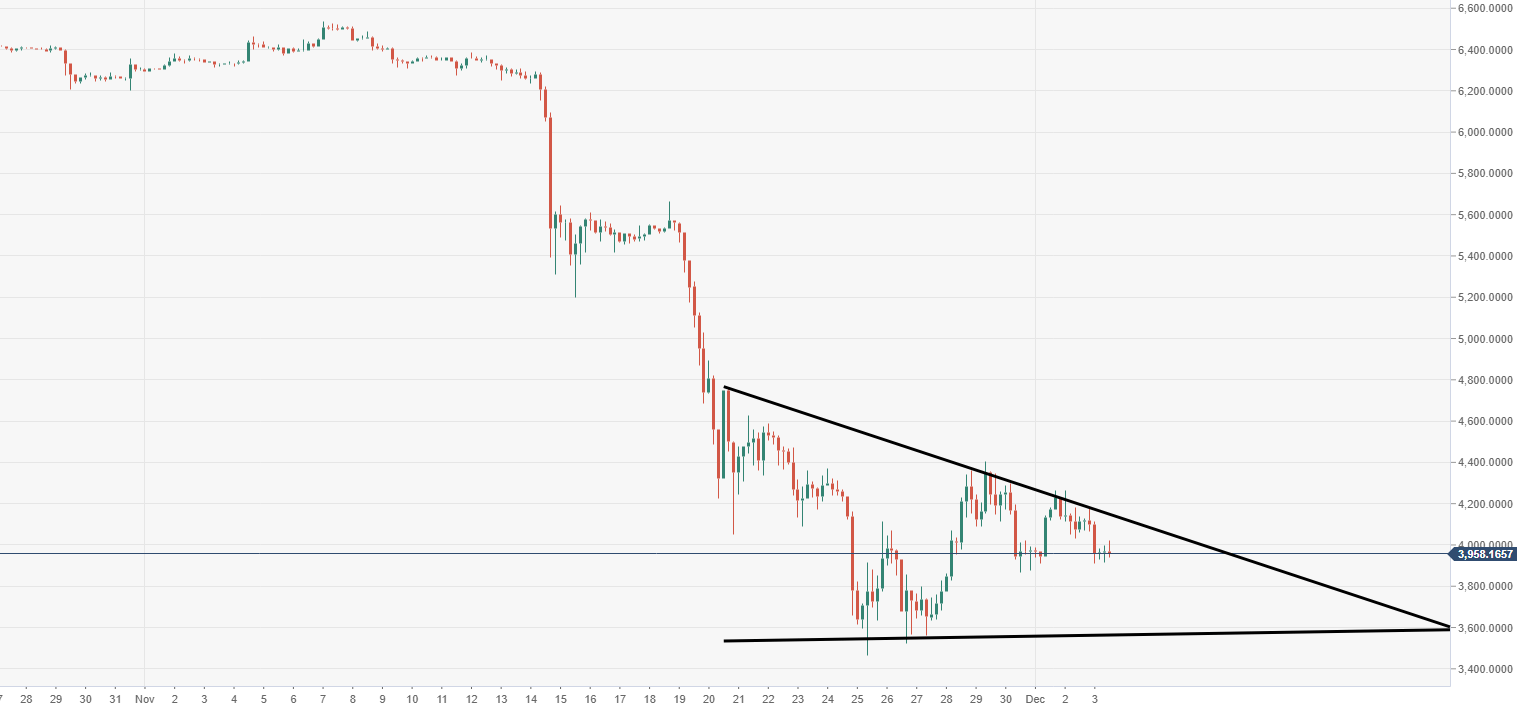
Spot rate: 3952.76
Relative change: -3.66%
High: 4020.68
Low: 3912.80
Trend: Bearish
Support 1: 3901.37, daily pivot point support.
Support 2: 3770.41, daily pivot point support.
Support 3: 3563.81, lower part of triangular pattern.
Resistance 1: 4140.27, upper part of triangular pattern.
Resistance 2: 4230.72, daily pivot point resistance.
Resistance 3: 4361.68, daily pivot point resistance.
BTC/USD 60-minute chart
- Price action demonstrates via the 60-minute chart view of an imminent breakout for BTC/USD.