- Bitcoin was seen down on Wednesday over 2%, after running into a barrier, taking steam out of its upside movement.
- Bitcoin’s next challenge and key for further upside is to break near-term strong resistance heading into $8500.
BTC/USD 15-minute chart
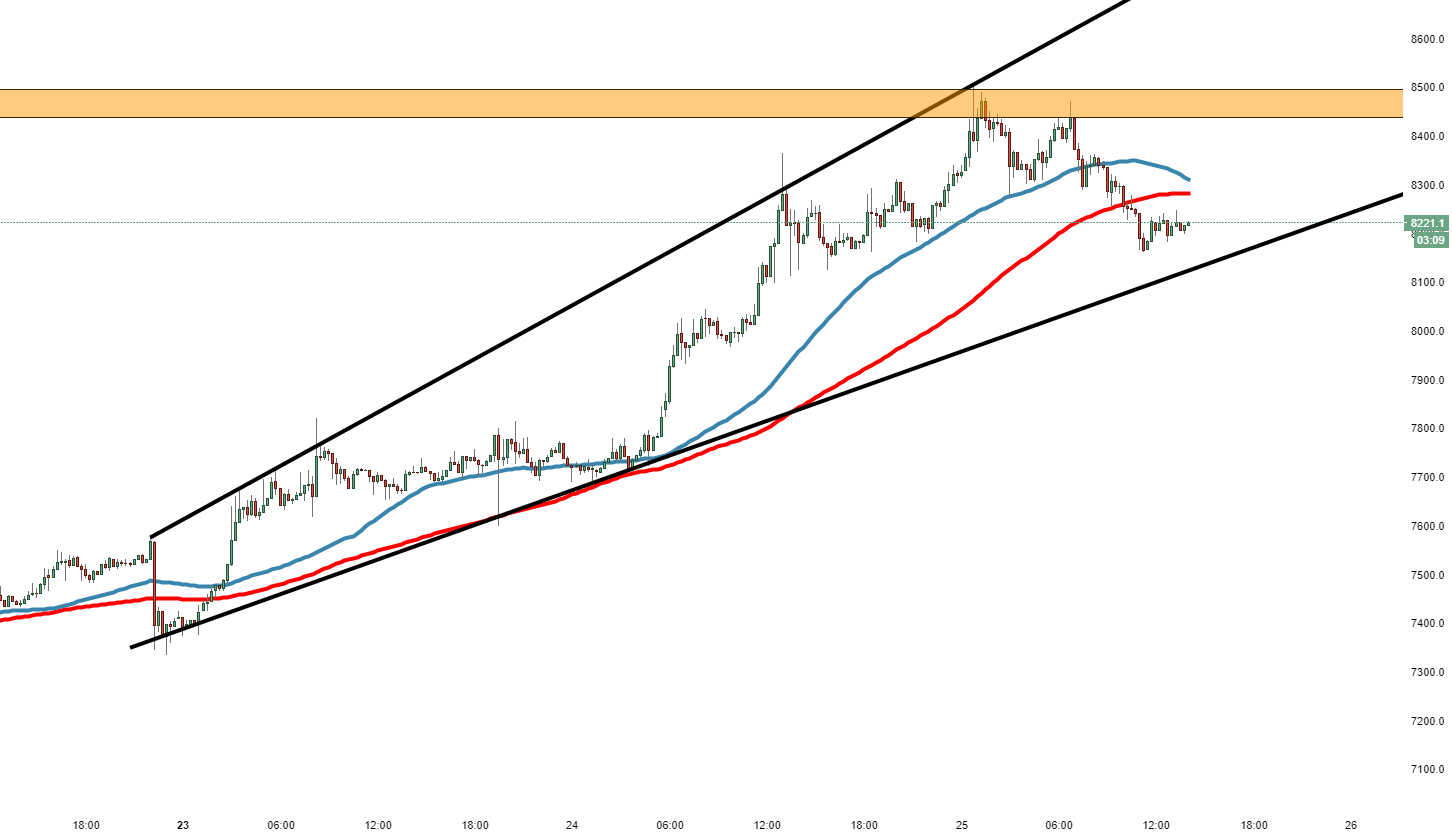
Spot rate: 8222.0
Relative change: -2.00%
High: 8488.1
Low: 8160.0
Trend: Bullish.
Resistance 1: 8275.0, 100MA.
Resistance 2: 8303.7, 50MA.
Resistance 3: 8435.1, supply zone entrance.
Support 1: 8131.3, lower part of ascending wedge pattern.
Support 2: 8000.0, psychological support.
Support 3: 7690.0, 24th July low.
