- Bitcoin price in the session on Thursday is trading with losses of some 0.45%.
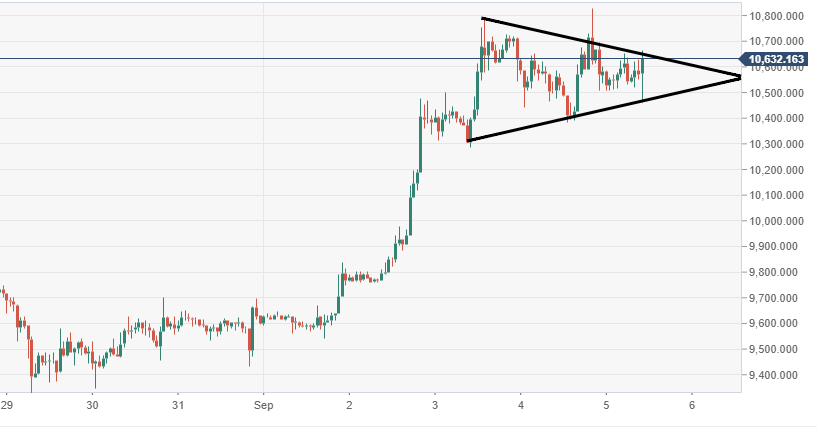
- BTC/USD price action is moving within a narrowing triangular structure, moving closer towards a breakout.
- The bulls must break down supply running from $10,500-11,000 range.
Spot rate:
Relative change: +0.50%
High: 10,663.35
Low: 10,459.78a
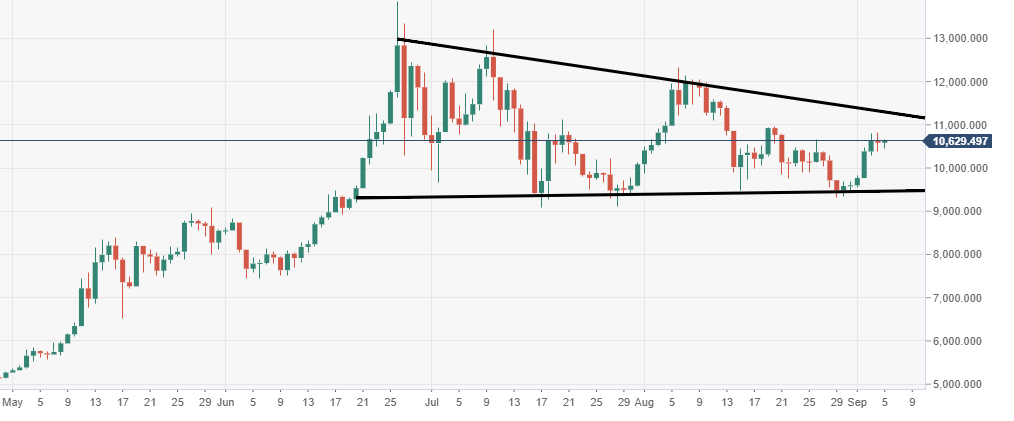
BTC/USD daily chart
- Price action is narrowing within a large triangular structure, subject to a breakout.
BTC/USD 60-minute chart
- Near-term price action is moving within a bullish pennant structure via the 60-minute.