- Bitcoin price on Tuesday jumps around 3% in the second half of the session.
- BTC/USD price momentum pointing to the upside, but bulls must break vital game-changing resistance.
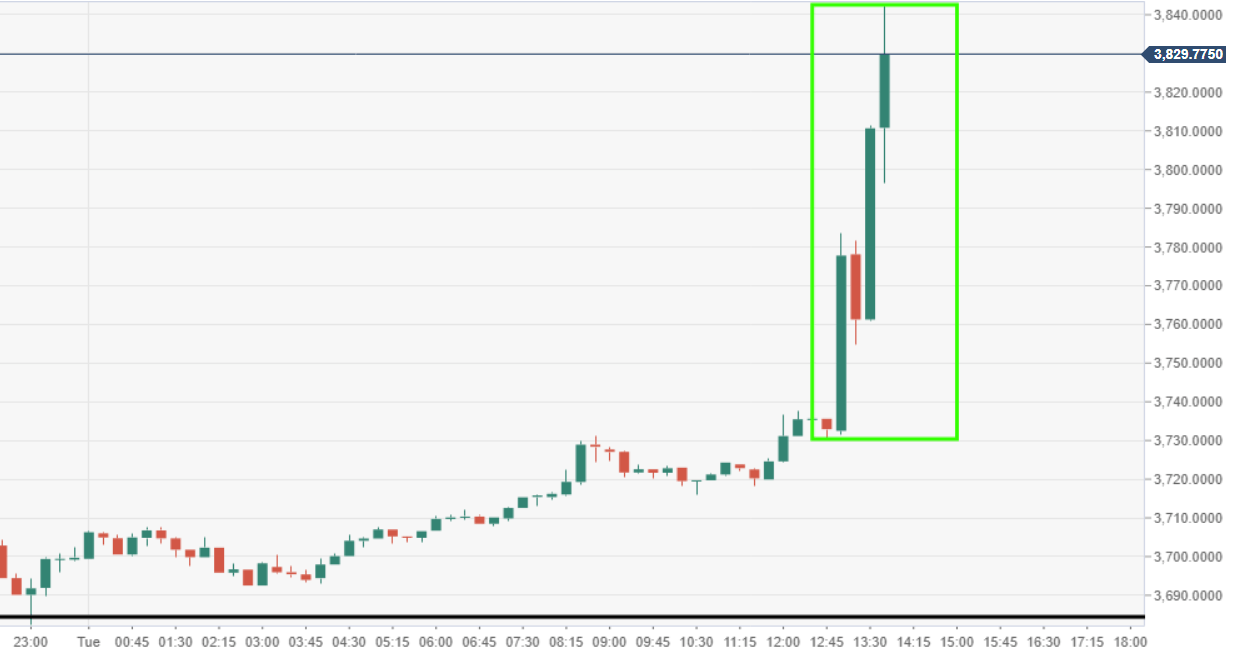
BTC/USD 15-minute chart
- Price action breaking out to the upside at session highs, buying kicked in at the low of current daily trading range-block.
Spot rate: 3806.05
Relative change: +2.95%
High: 3816.70
Low: 3696.52
Trend: Bullish
Trends:
Daily SMA20: 3764.68
Daily SMA50: 3621.07
Daily SMA100: 3712.11
Daily SMA200: 5072.68
Levels:
Previous Daily High: 3804.73
Previous Daily Low: 3672.34
Previous Weekly High: 4187.25
Previous Weekly Low: 3659.1
Previous Monthly High: 4187.25
Previous Monthly Low: 3338.98
Daily Fibonacci 38.2%: 3722.91
Daily Fibonacci 61.8%: 3754.15
Daily Pivot Point S1: 3646.45
Daily Pivot Point S2: 3593.2
Daily Pivot Point S3: 3514.06
Daily Pivot Point R1: 3778.84
Daily Pivot Point R2: 3857.97
Daily Pivot Point R3: 3911.22
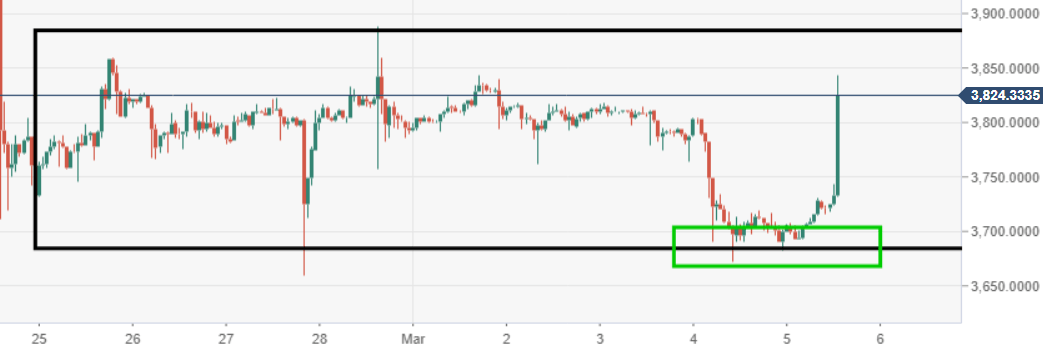
BTC/USD 60-minute chart
- Big buying coming in at the latter part of the daily range-block formation.
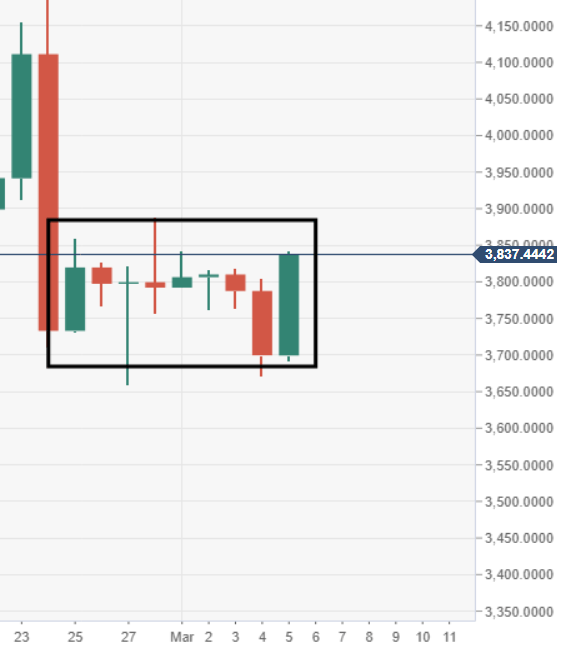
BTC/USD daily chart
- Price action via the daily chart view continues to move within a bearish flag formation, despite gains today.