- Bitcoin price is trading in negative territory, down some 0.90% in the second half of the session.
- BTC/USD has aggressively been within the control of the bears since 27 October.
- A rejection at $7500, strong daily resistance, could prove to be punishing.
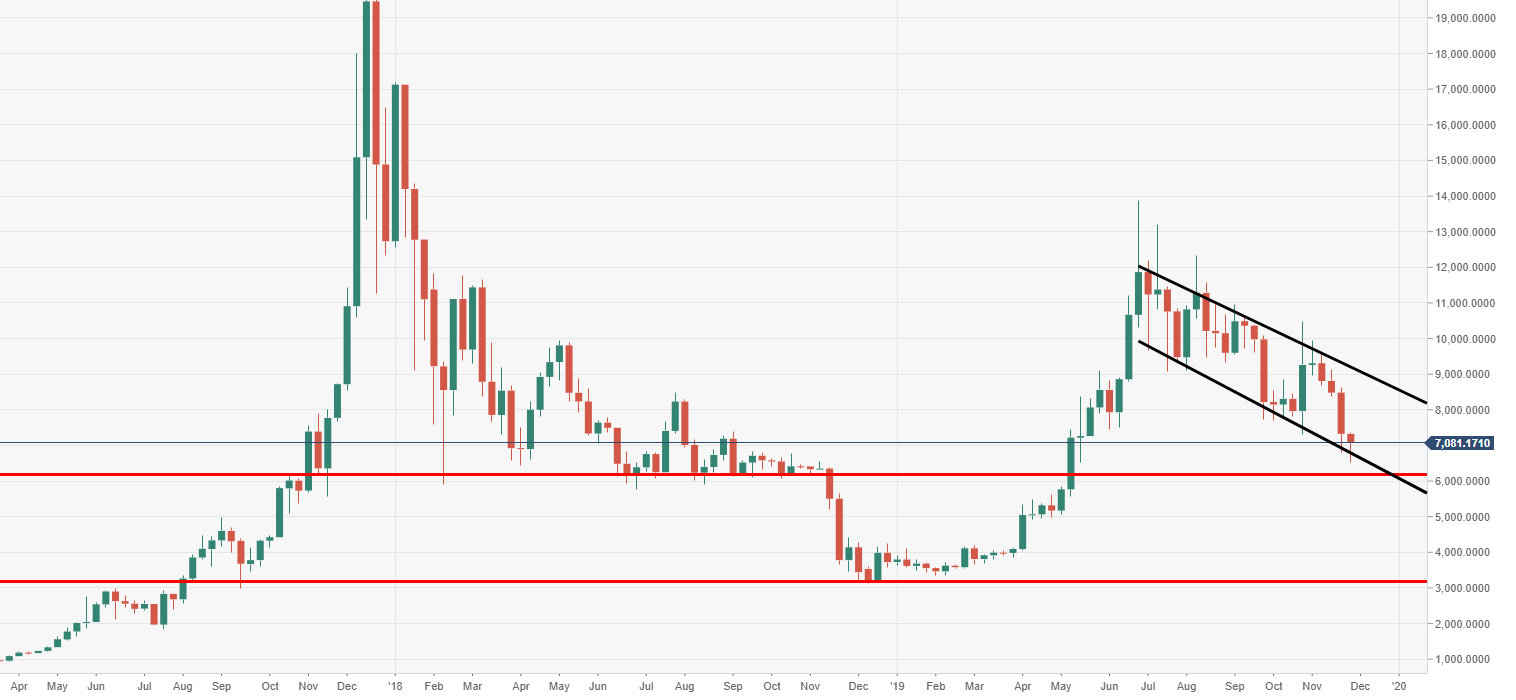
BTC/USD weekly chart
The price is running towards its fourth consecutive week in the red, following a failure to hold the $10,000 mark.
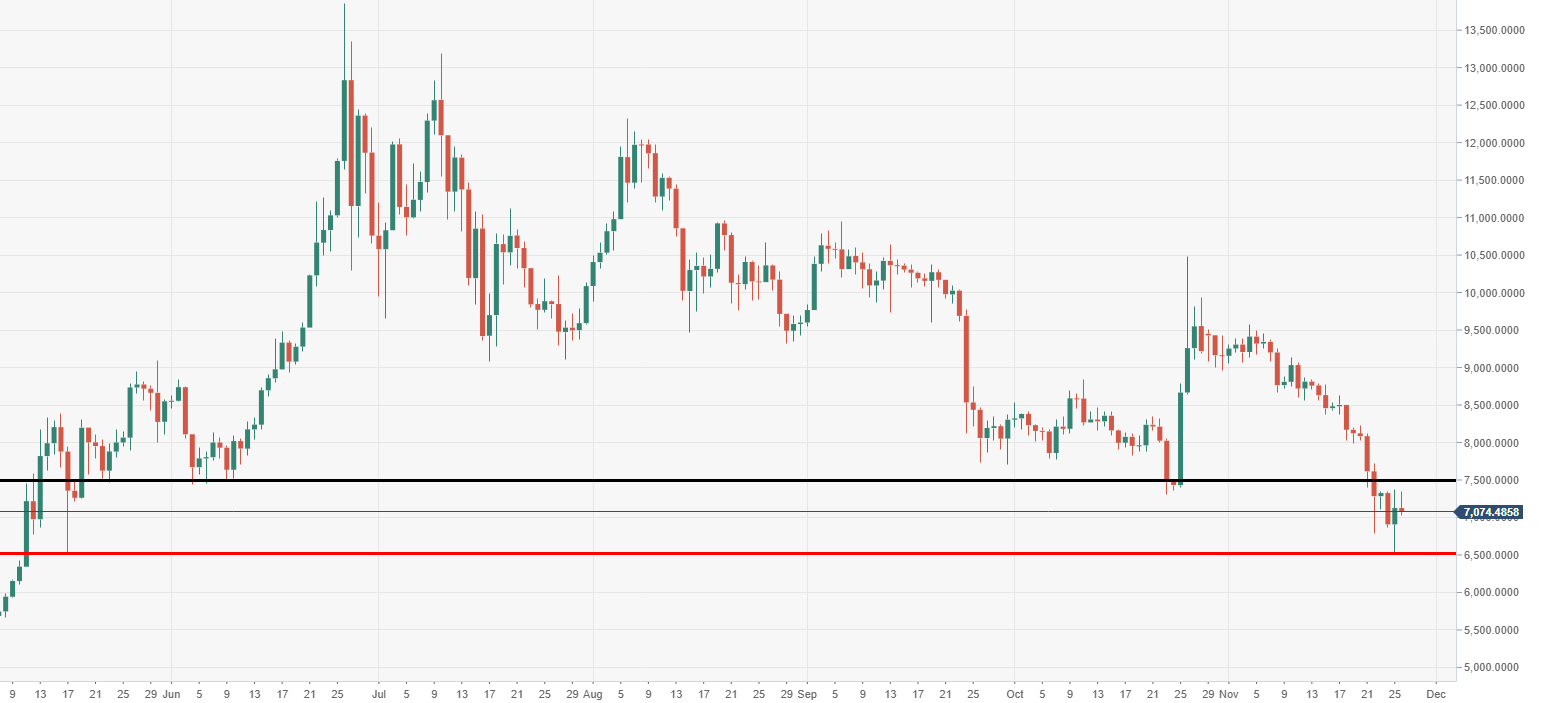
BTC/USD daily chart
The price could now likely have some issues being stuck between two critical areas, $7500 resistance and $6500 support.
Spot rate: 7072.26
Relative change: -0.70%
High: 7341.33
Low: 7023.51
