- Bitcoin price stabilizes after the chunky bull run seen in the prior session.
- BTC/USD does not have enough momentum at this time, to pass through supply zone, $6745-6775.
- Rising wedge pattern can be seen on the 30-minute chart view.
BTC/USD 30-minute chart
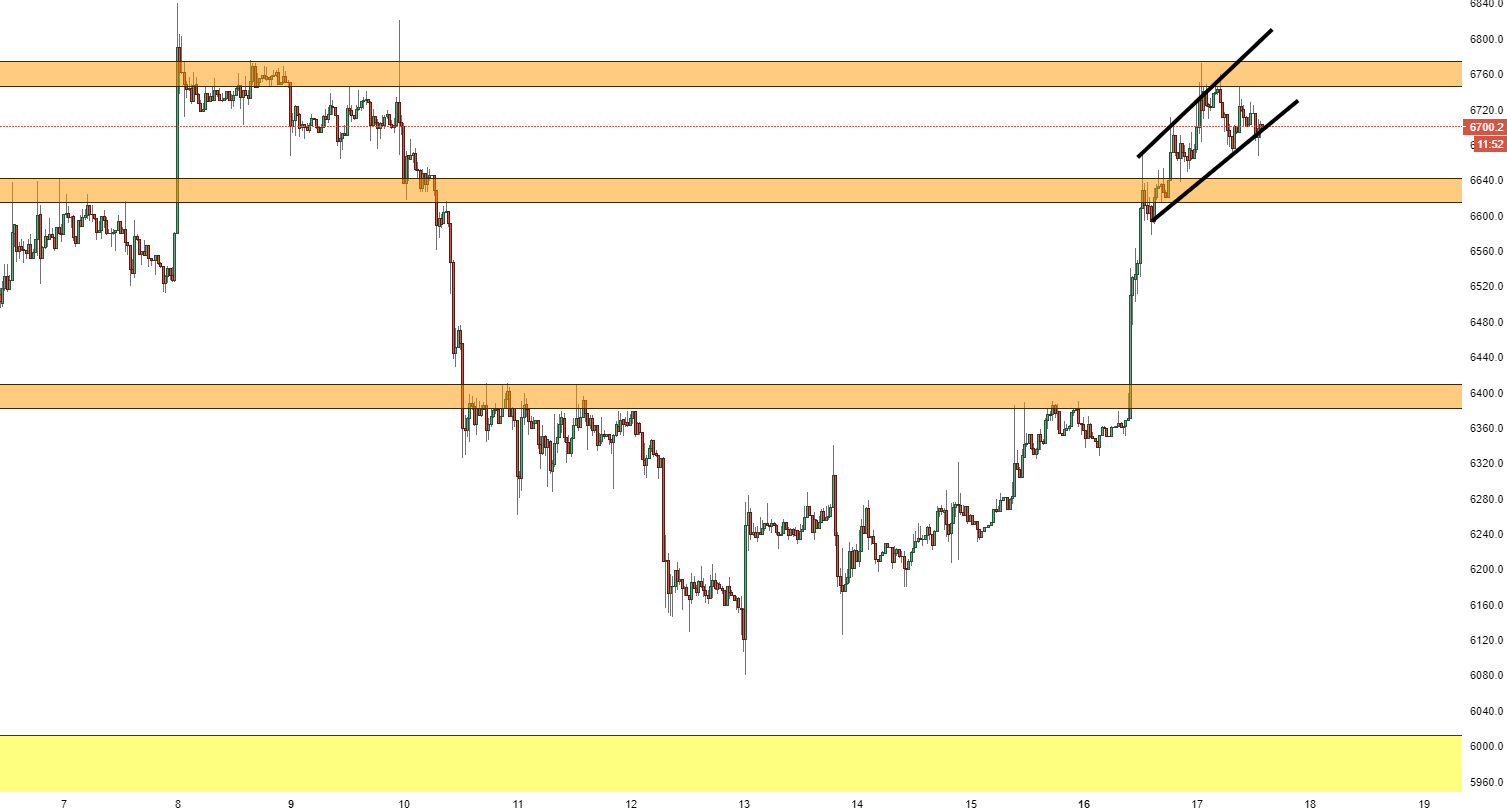
Spot rate: 6697.5
Relative change: -0.47%
High: 6771.0
Low: 6666.0
Trend: Neutral
Resistance 1: 6728.0, (resistance on 60-minute chart).
Resistance 2: 6745.0, supply zone entry.
Resistance 3: 6775, (resistance on 60-minute chart) & supply zone.
Support 1: 6690.5, lower wedge support.
Support 2: 6640.0, demand zone.
Support 3: 6561.2, (support on 60-minute chart).
