- Bitcoin price is trading marginally in the red down some 0.90% in the second half of the session.
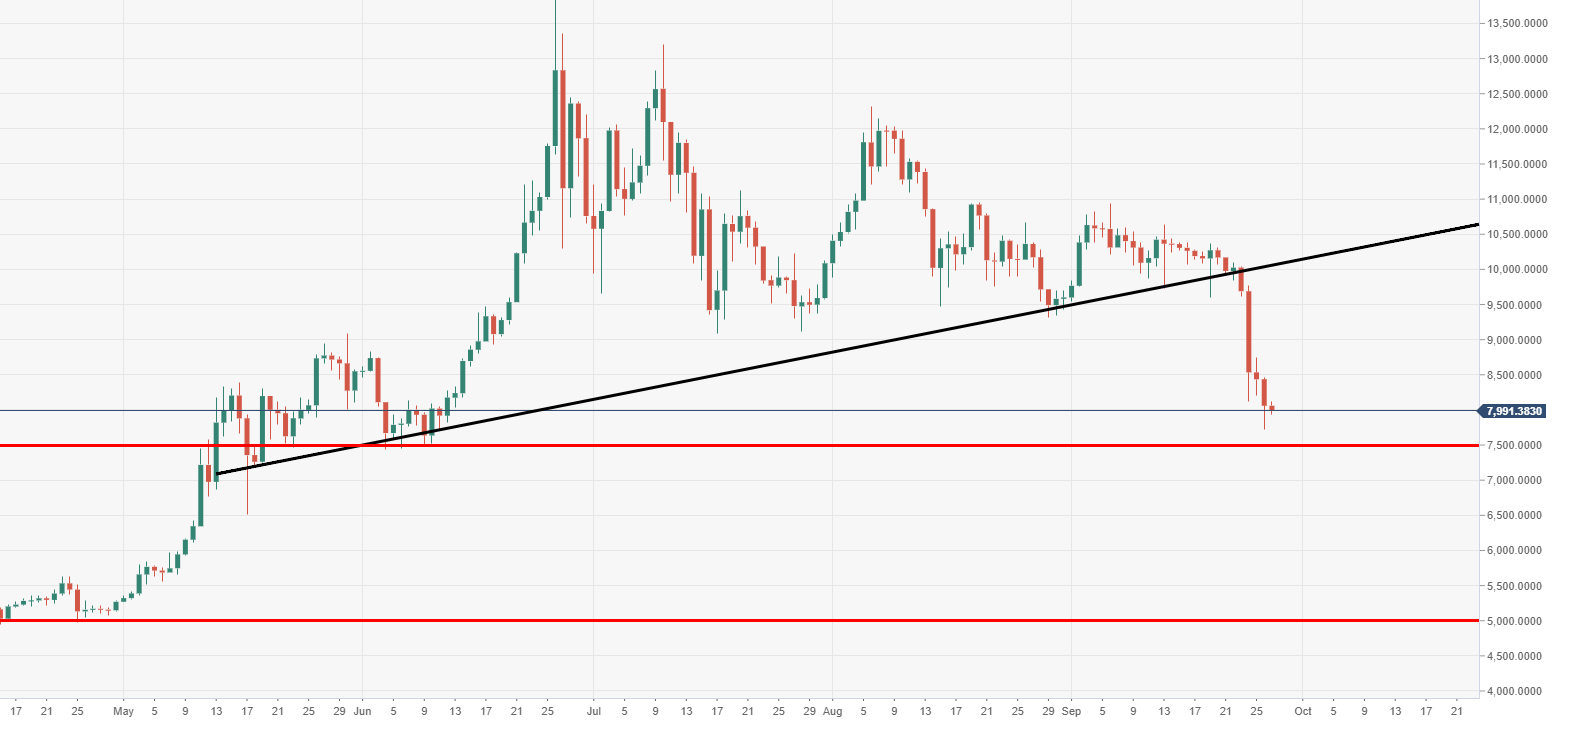
- BTC/USD price smashed through a critical ascending trend line of support, allowing a fresh wave of sellers to come into play.
- The price is heading for a big test of the $7500 daily support, failure to hold may be very punishing.
BTC/USD daily chart
The following major support would be eyed at $5000 mark, should $7500 give way.
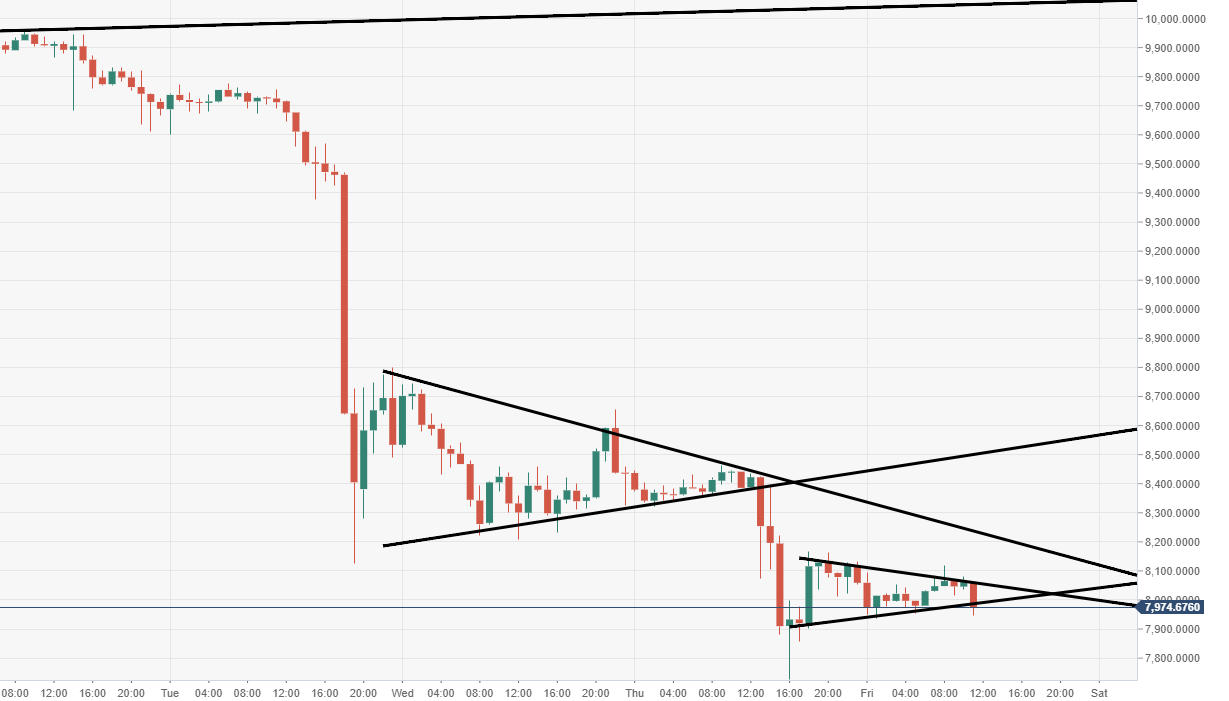
BTC/USD 60-minute chart
Price action has formed another bearish pennant which is subject to a breakout.
Spot rate: 8439.4
Relative change: -0.20%
High: 8118.85
Low: 7937.57
