Home Bitcoin technical analysis: BTC/USD critical daily trend line prevents devastation for now
Crypto News

Bitcoin technical analysis: BTC/USD critical daily trend line prevents devastation for now

  • Bitcoin price is trading down some 11% in the second half of the session on Friday.  
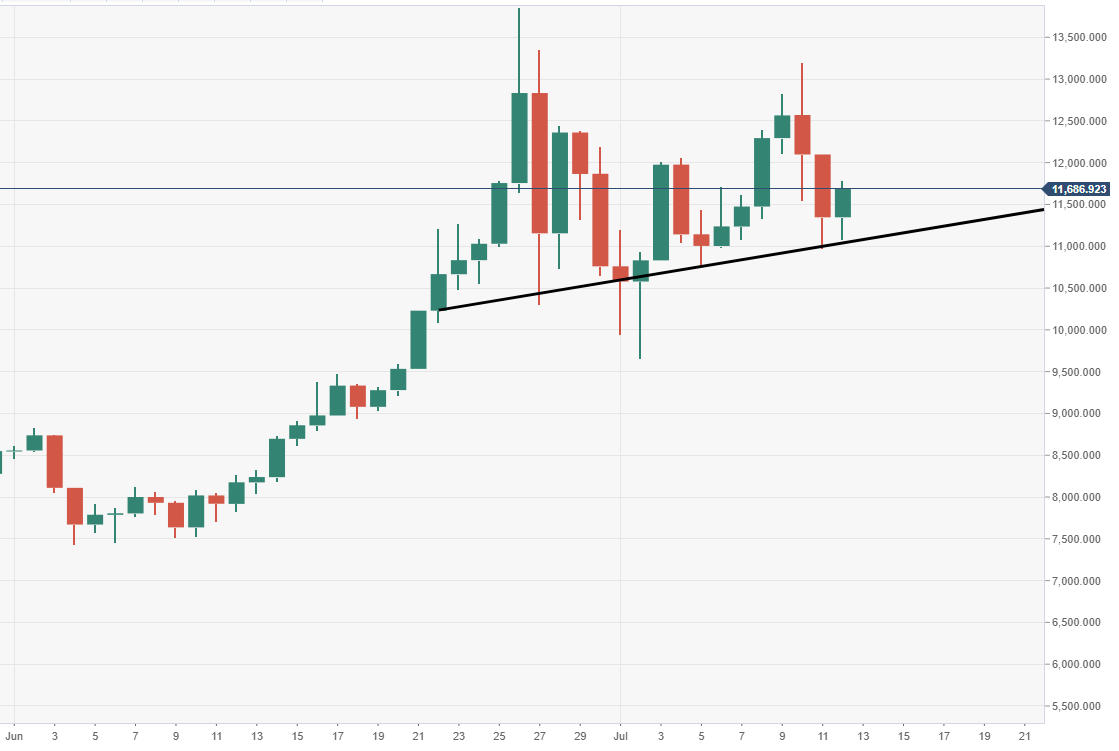
  • BTC/USD price action via the daily chart view is testing a critical daily trend line to the downside.  
  • The noted support can be seen tracking around $11,000 price mark.  


Spot rate:                 11,682.06  

Relative change:       +2.95%

High:                         11,785.39

Low:                          11,085.27

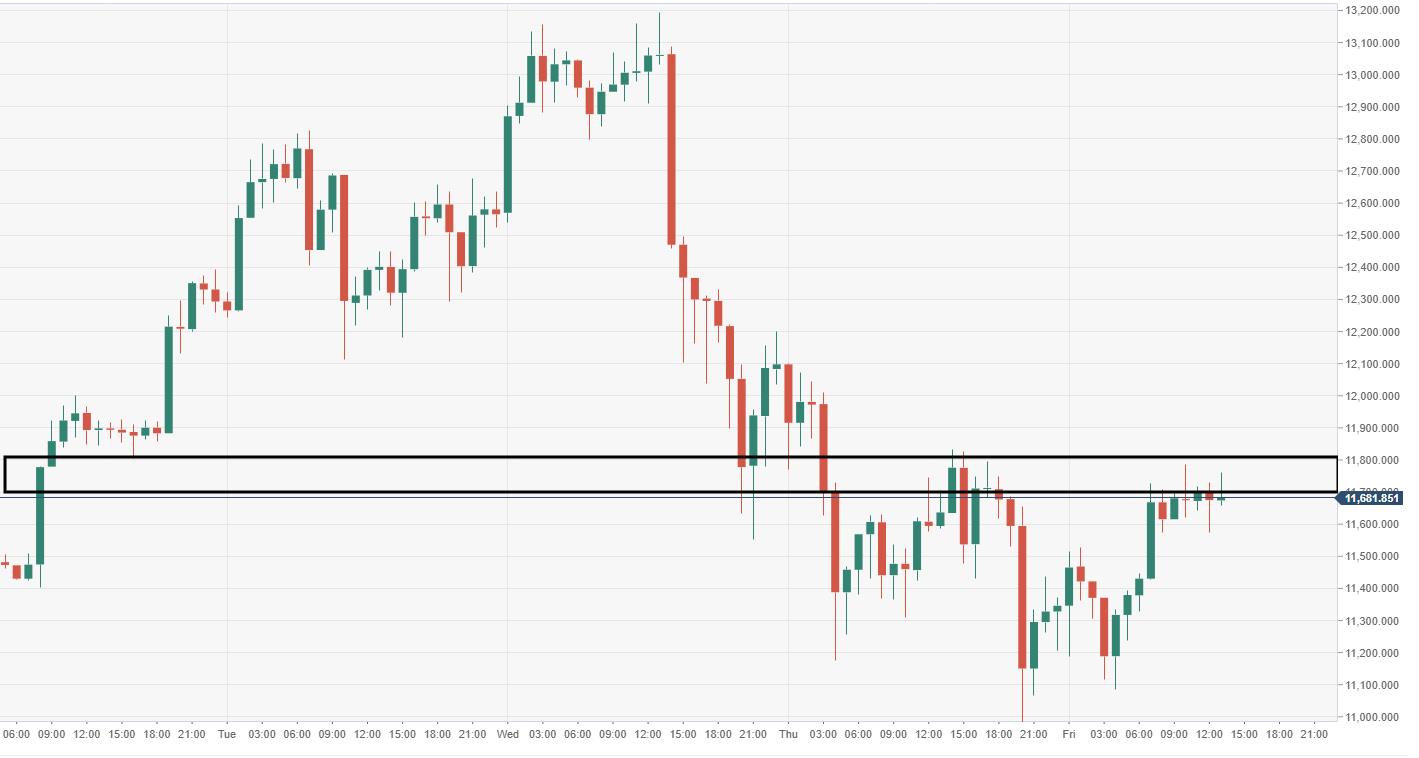
BTC/USD 60-minute chart

  • Upside is capped by a barrier running from $11,600-800 range via the 60-minute.


BTC/USD daily chart

  • Daily ascending trend line stops the bears from causing a chunky wave of selling pressure.  

FX Street

FX Street

FXStreet is the leading independent portal dedicated to the Foreign Exchange (Forex) market. It was launched in 2000 and the portal has always been proud of their unyielding commitment to provide objective and unbiased information, to enable their users to take better and more confident decisions.