- Bitcoin price on Wednesday seen holding minor gains of 0.5%, but participants remain cautious.
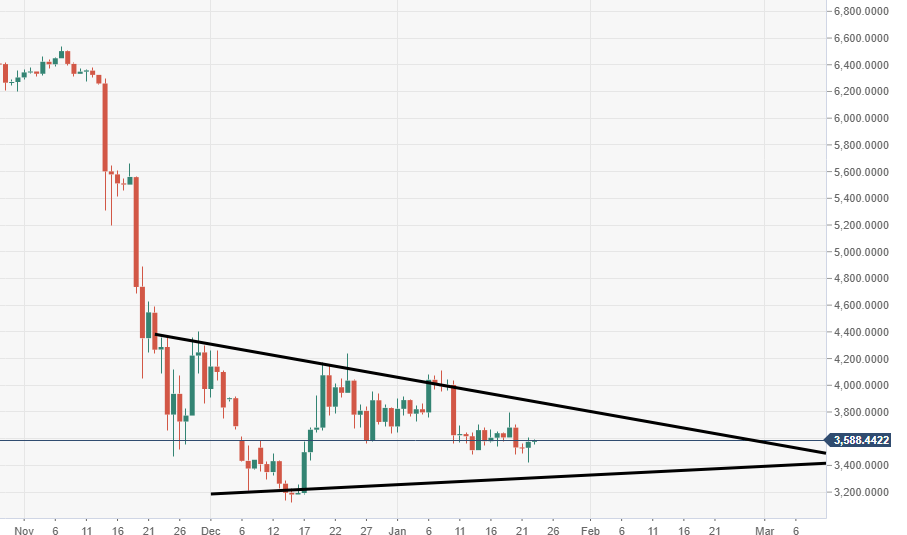
- BTC/USD price action over the daily time frame, has formed a bearish pennant structure.
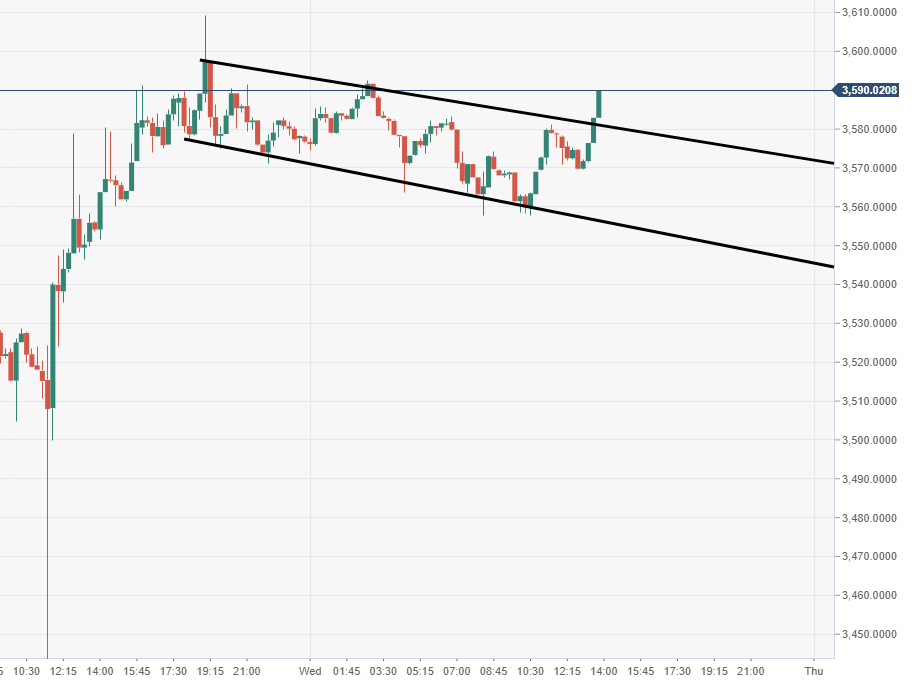
BTC/USD 15-minute chart
- Bulls make near-term breakout from a bullish flag pattern structure.
Spot rate: 3588.27
Relative change: +0.52%
High: 3592.52
Low: 3557.72
Trend: Neutral
Support 1: 3464.96, daily pivot point support.
Support 2: 3353.14, daily pivot point support.
Support 3: 3280.95, daily pivot point support.
Resistance 1: 3648.98, daily pivot point resistance.
Resistance 2: 3721.17, daily pivot point resistance.
Resistance 3: 3832.99, daily pivot point resistance.
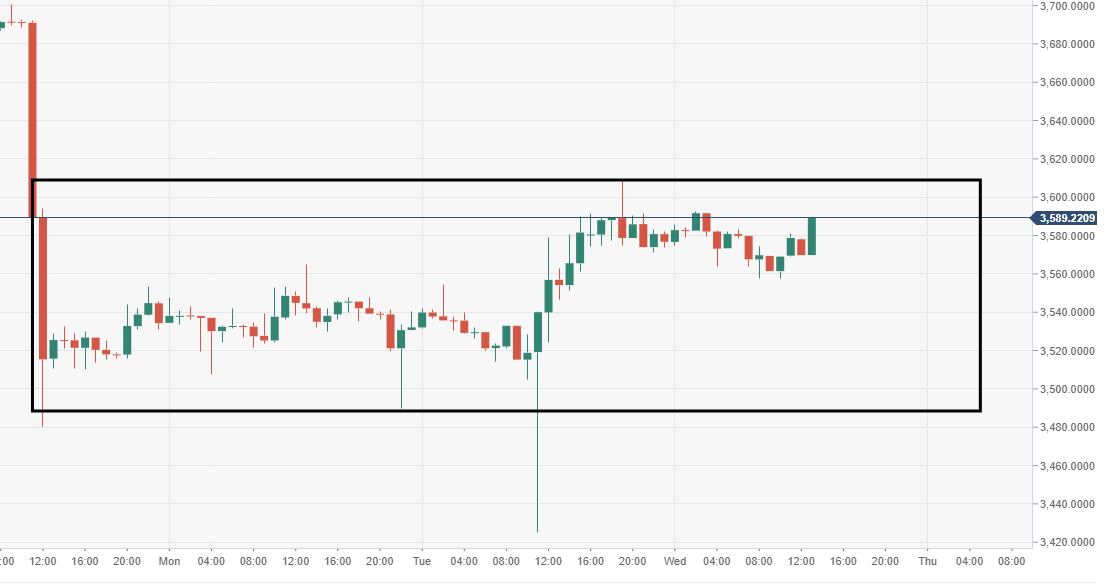
BTC/USD 60-minute chart
- BTC/USD price action is gunning towards a breakout of a 60-minute range-block.
BTC/USD daily chart
- BTC/USD moving within a bearish pennant pattern structure, subject to a breakout south.