Home Bitcoin Technical Analysis: BTC/USD erases more than $300 on Tuesday, daily RSI turns south below 50
Crypto News

Bitcoin Technical Analysis: BTC/USD erases more than $300 on Tuesday, daily RSI turns south below 50

  • BTC/USD drops below $6400 to retrace all of its gains from the previous week as negative sentiment allows sellers to continue to dominate the market.
  • Daily RSI fails to stay above 50 suggesting that the bearish momentum is gathering strength.  
  • 2018 low that was set in late June at $5750 aligns as the next critical target in the short-term.
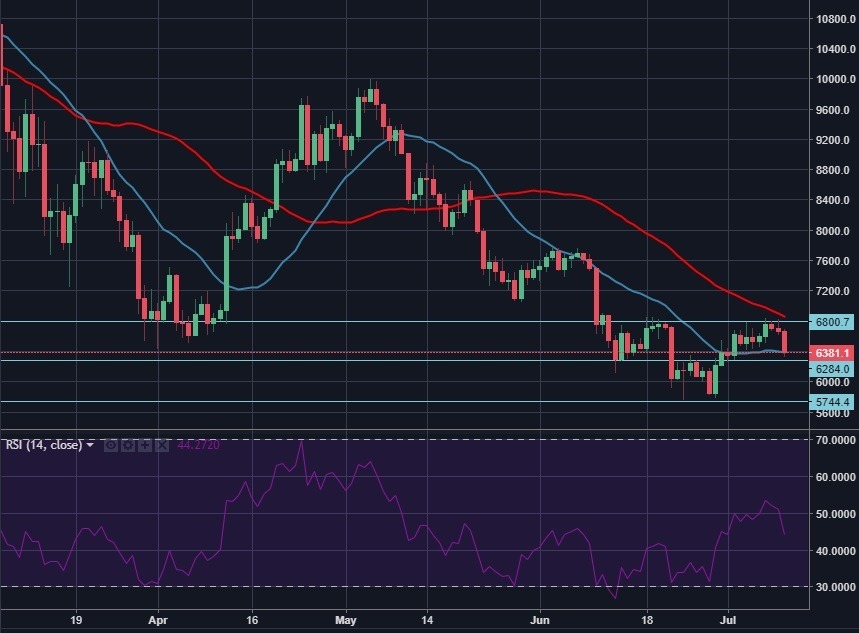
BTC/USD daily chart

Spot rate:                  6381.1

Relative change:        -4.3%

High:                         6685.8

Low:                          6324.8


Trend:                      Bearish


Support 1:                 6270  (Jun. 14 low/horizontal level).

Support 2:                 5750 (2018 low/Jun. 24 low).    

Support 3:                 5500 (Oct. 24, 2017, low).    

Resistance  1:            6800/6850 (daily high/20-DMA).

Resistance 2:            7000 (psychological level).

Resistance 3:            7750 (Jun. 7 high/horizontal level).

FX Street

FX Street

FXStreet is the leading independent portal dedicated to the Foreign Exchange (Forex) market. It was launched in 2000 and the portal has always been proud of their unyielding commitment to provide objective and unbiased information, to enable their users to take better and more confident decisions.