- Bitcoin price is seen down over 1.5% on Wednesday, in an initial muted first half to the session so far.
- BTC/USD is trading close to an ascending trend line for support, after really easing away from the highs at the begging of the week.
- Bitcoin may look to take another rally to the upside, testing the tops of the week seen at the $6850 area.
BTC/USD 30-minute chart
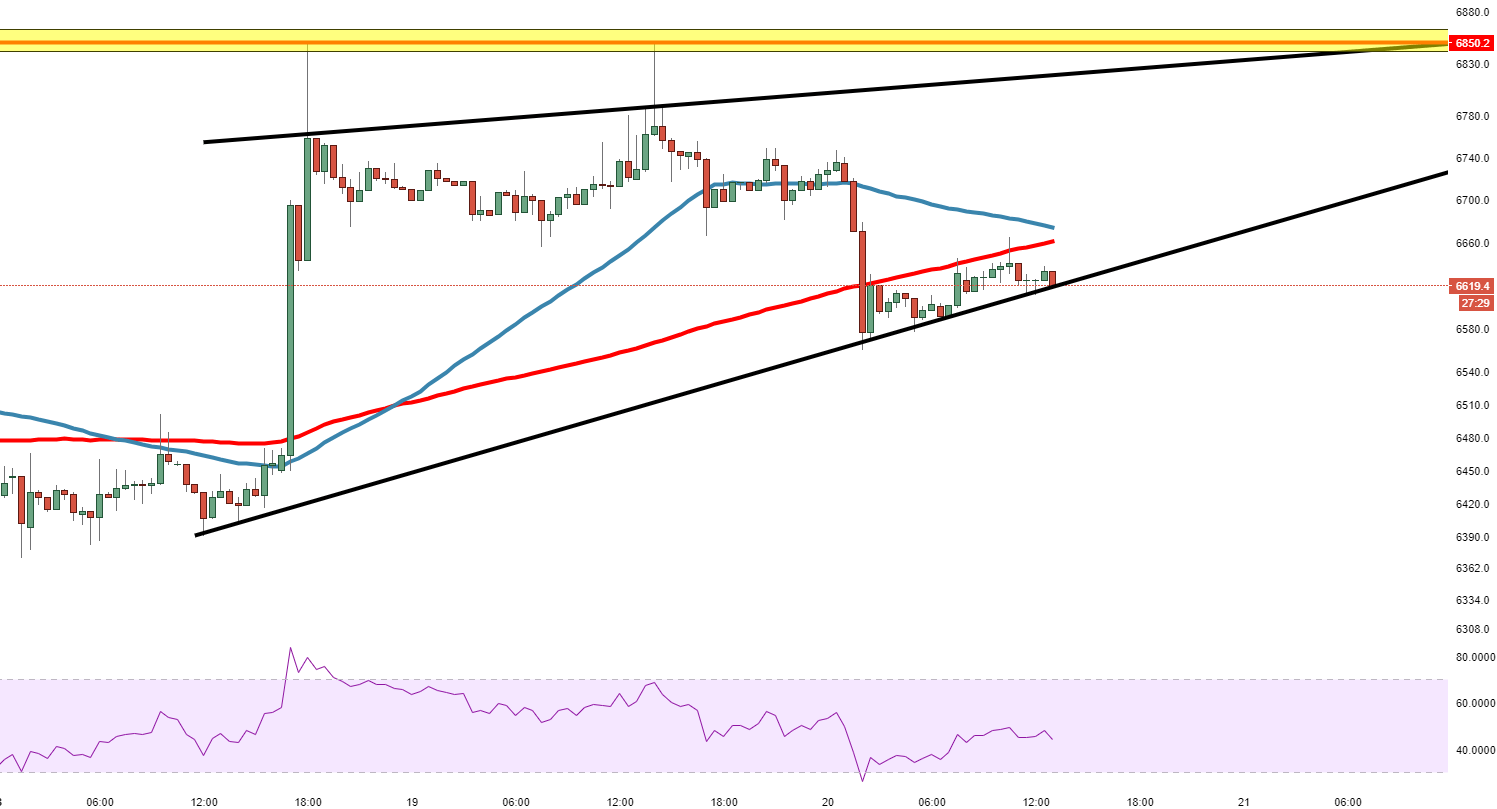
Spot rate: 6633.10
Relative change: -1.52%
High: 6739.9
Low: 6560.0
Trend: Bearish
Support 1: 6610.0, ascending trend line.
Support 2: 6570.1, (support on 30-minute chart).
Support 3: 6450.0, demand area.
Resistance 1: 6660.0, 100MA.
Resistance 2: 6675.0, previous demand zone.
Resistance 3: 6816, upper trend line of wedge pattern.
