- Bitcoin price is trading in the red, down marginally by some 0.10% in the second half of the session.
- BTC/USD is moving within consolidation mode, which has been the case for some five weeks now.
- The price range is further narrowing, which would suggest an approaching breakout to come.
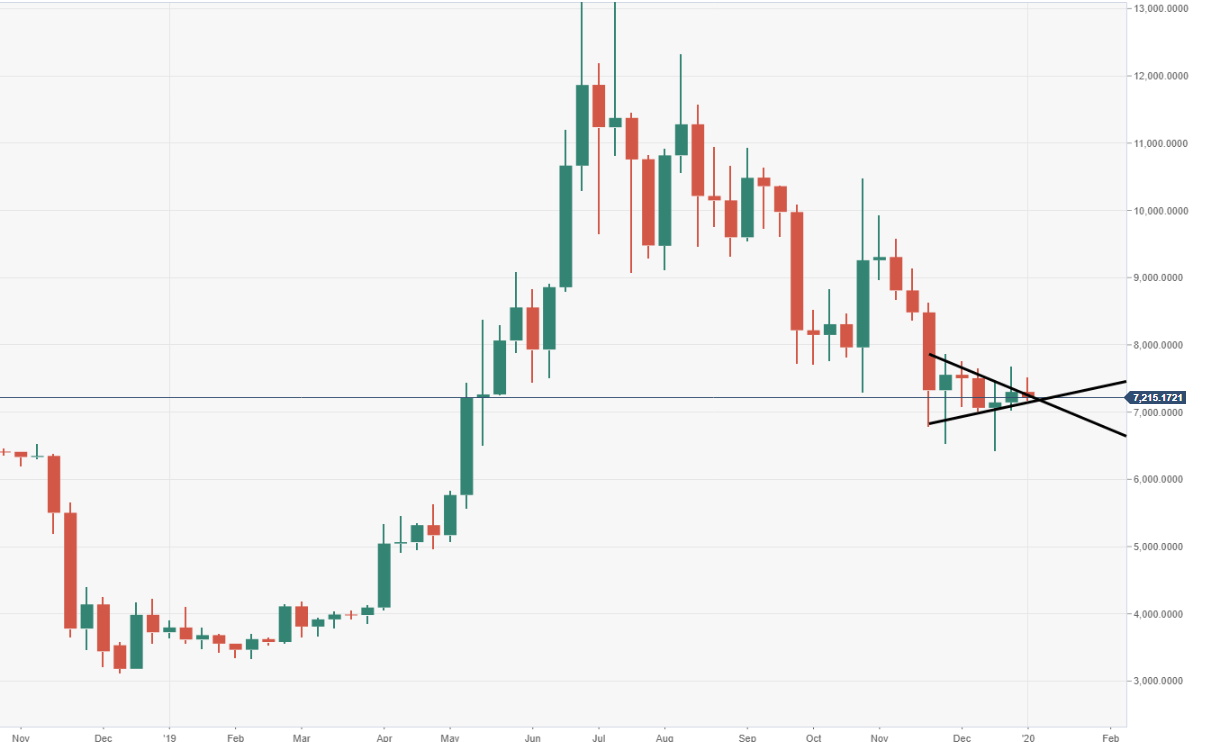
BTC/USD weekly chart
Price conditions are tight within a bearish pennant pattern, range high at $7500, low around $7000.
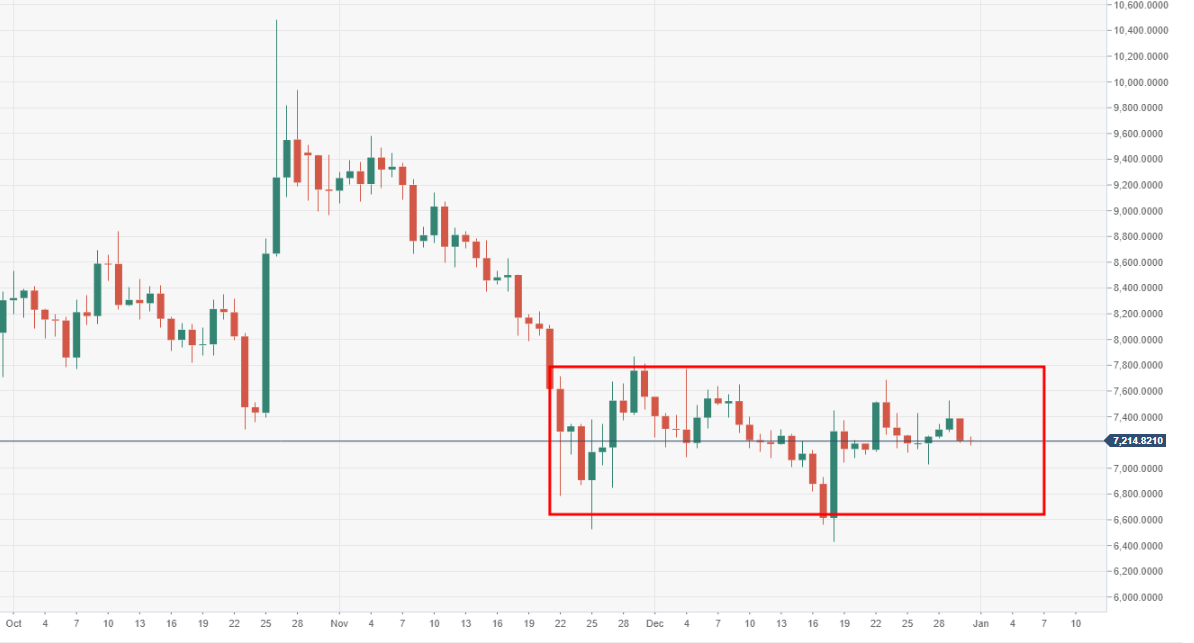
BTC/USD daily chart
The current price range block has been in play since BTC stopped falling after the October-November drop. Consolidation mode has been observed since 22 November.
Spot rate: 7150.86
Relative change: -1.10%
High: 7243.79
Low: 7177.61
