- Bitcoin price is trading marginally in the red, down some 1.00% in the second half of the session.
- BTC/USD bulls are making an attempt to test the upper resistance of a narrowing range-block formation.
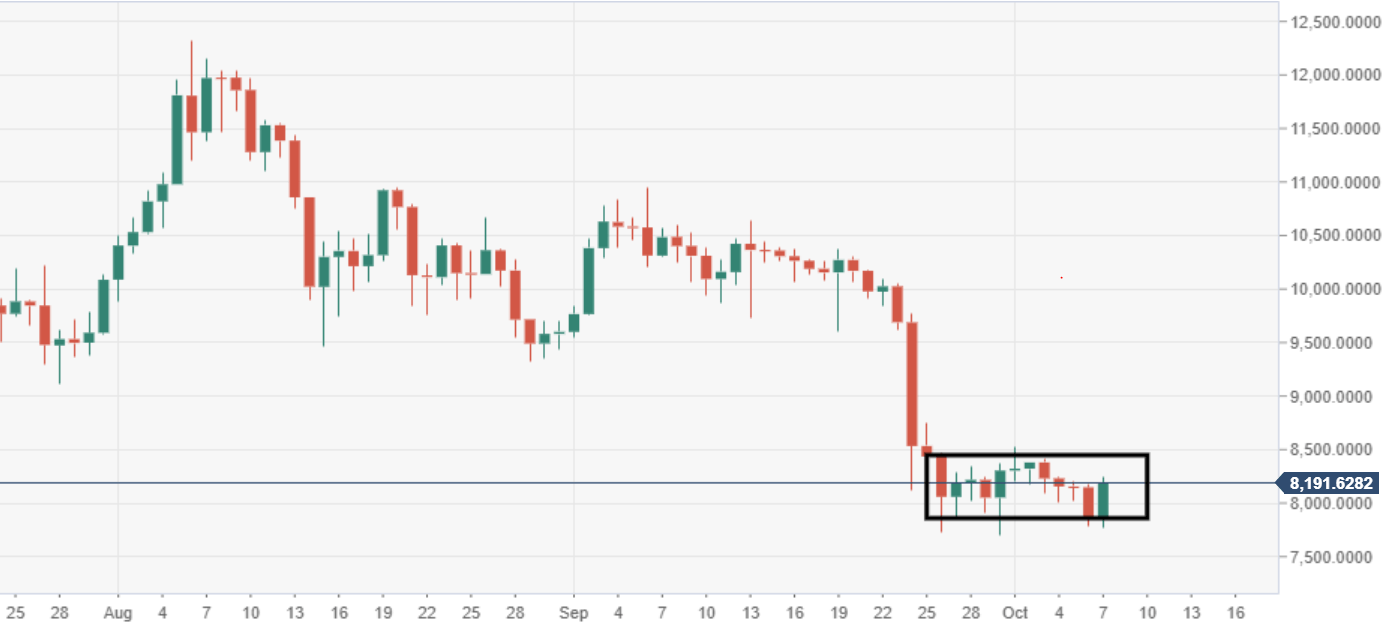
- A heavy barrier of resistance can be observed at $8500, BTC has not traded above since 25 September.
BTC/USD daily chart
The price has managed to catch some bull momentum for the first time in four days.
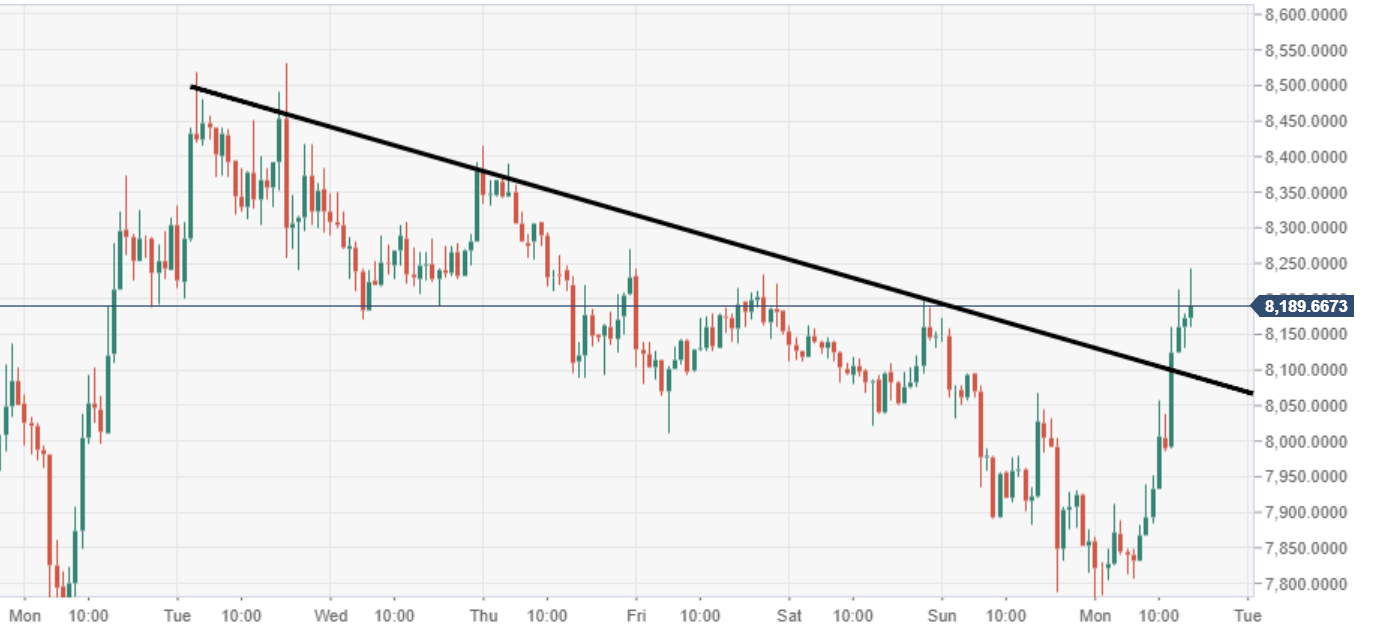
BTC/USD 60-minute chart
Bitcoin has broken above near-term resistance at the $8000 mark and moving north of a descending trend line.
Spot rate: 8,137.92
Relative change: +4.20%
High: 8,242.48
Low: 8,011.02
